Xavier Diví
 Private: Joaquín Rodríguez Kierce
 Private: Griselle Bigio
 In general, Puerto Rico hospitals score lower than the national average in quality metrics, based on reports from the Centers for Medicare and Medicaid Services (CMS) Hospital Compare database1. The difference is significant in metrics related to readmission, mortality, and Emergency Department (ED) care. In this Insight we analyze several of these outcomes and explore the possible reasons behind them.
A look at Puerto Rico hospitals quality metrics
Access, quality and cost are considered the "triple aim" in healthcare. In a hospital setting, the timeliness and effectiveness with which care is provided plays a critical role in a community’ public health. The Hospital Compare database published by CMS provides a detailed description of the performance of hospitals according to defined quality criteria. Compared to the rest of the United States, Puerto Rico’ hospitals, when grouped together, rank last in most quality measures. We have conducted an analysis at a national, state, and local level, aiming to quantify the disparity between the quality of Puerto Rican hospital care with that of the rest of the country, with a special focus on readmission, mortality, and ED care.
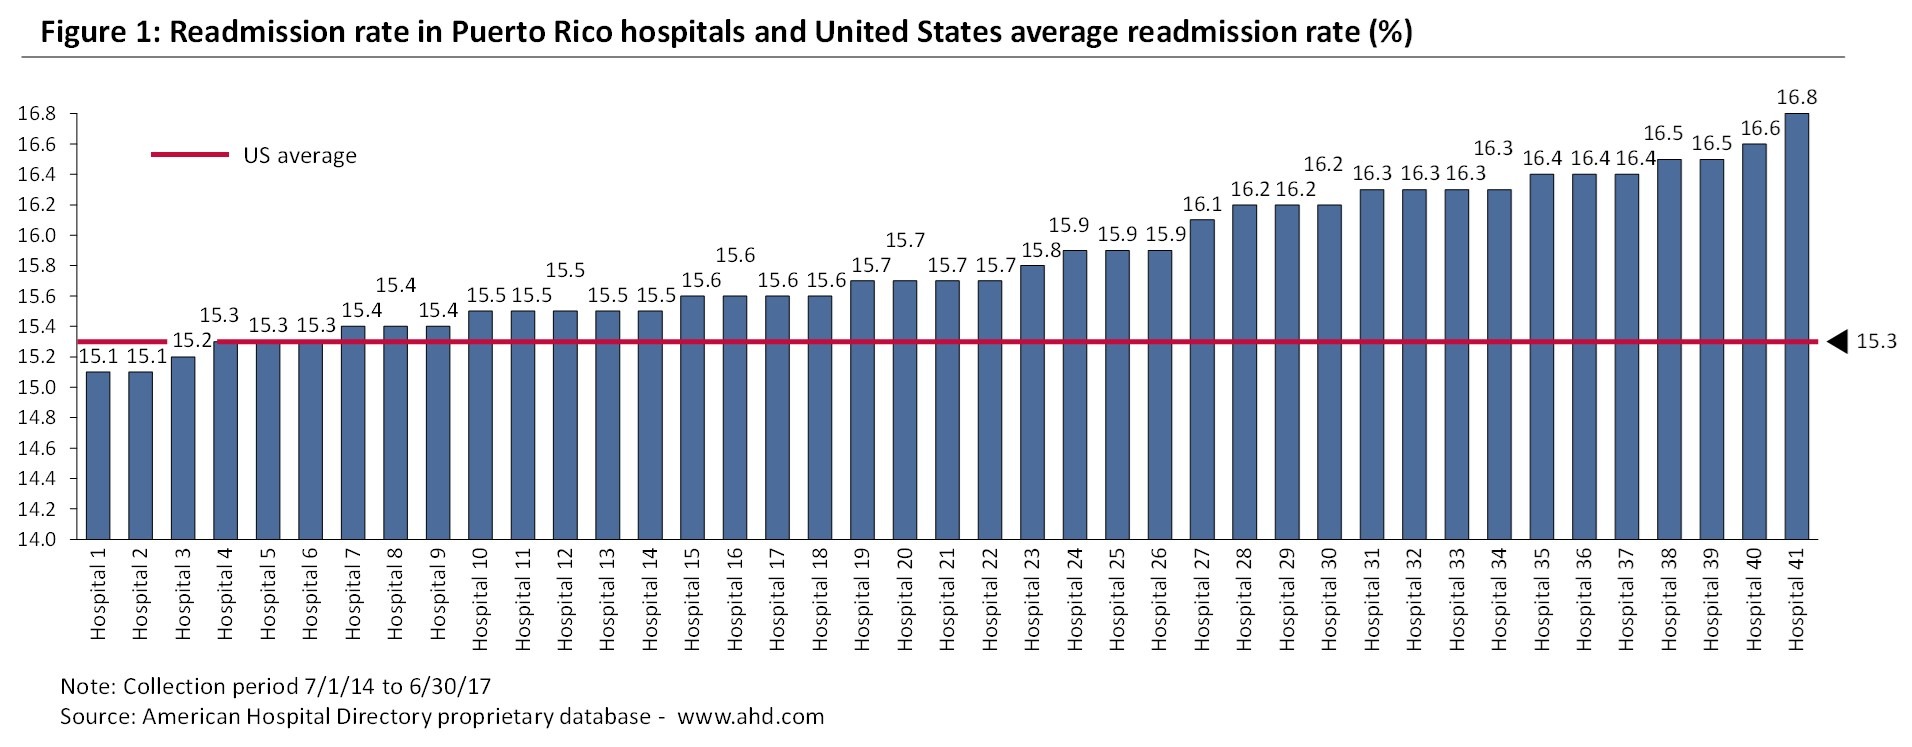
The readmission rate measures the percentage of patients who had an unplanned readmission to the hospital within 30 days of discharge. As can be observed in Figure 1, 35 out 41 Puerto Rico hospitals show readmission rates above the US average (15.3%).
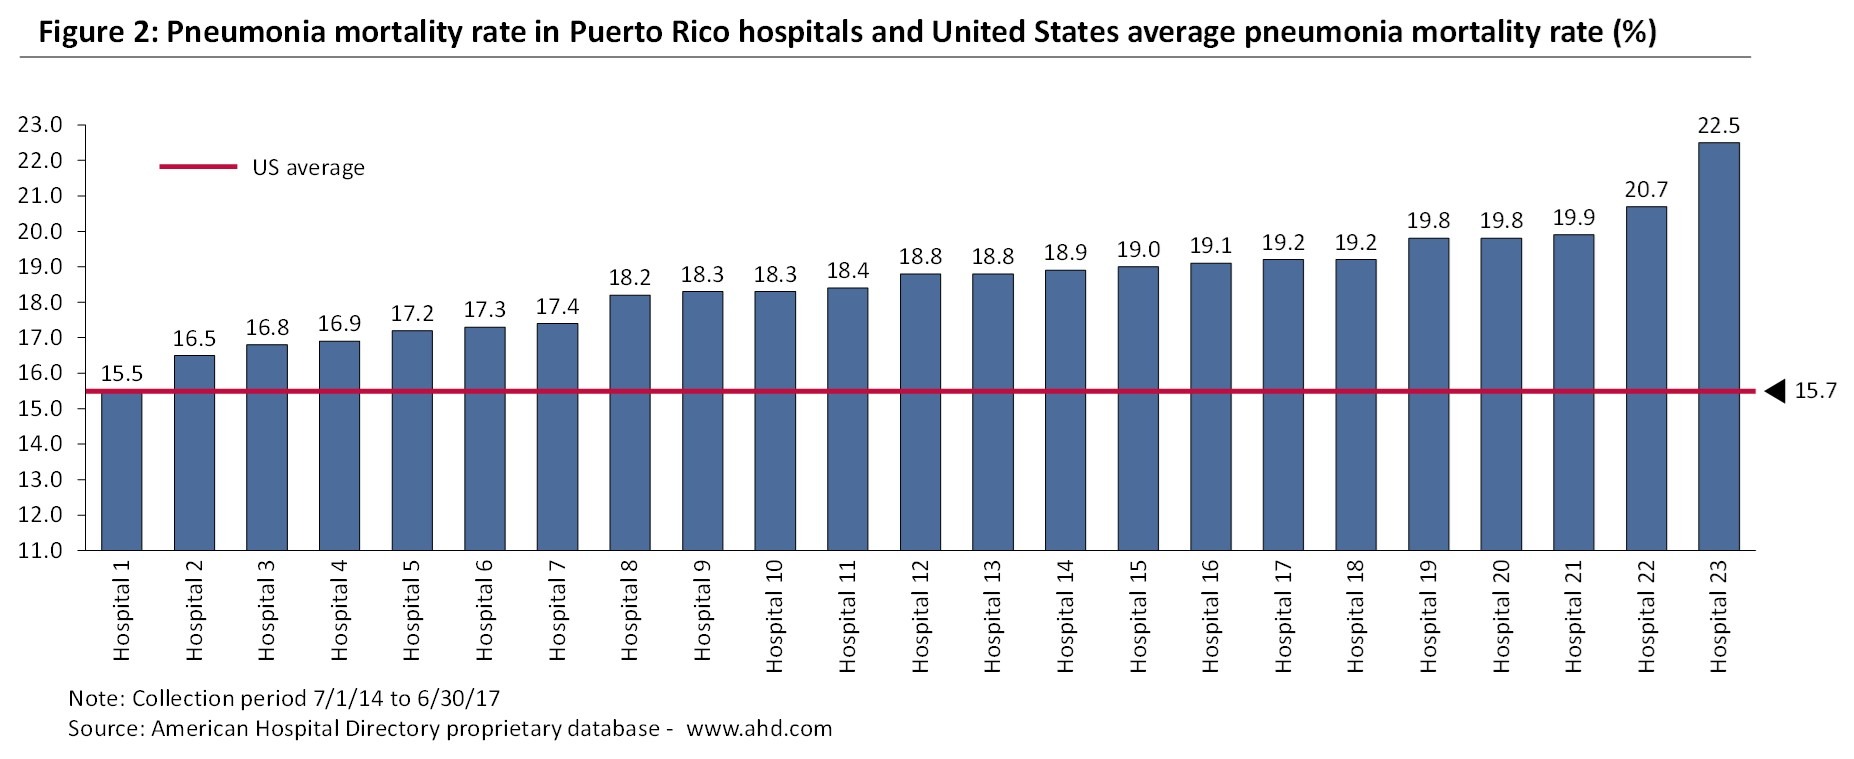
A similar pattern can be observed when we look at the mortality rate which is the percentage of patients that died (for any reason) in the 30 days after either entering the hospital or having a Coronary Artery Bypass Graft (CABG) surgery. The mortality rate in Pneumonia patients is above the national average (15.7%) for 22 of the 23 Puerto Rico hospitals that report this metric, with one third of the hospitals reporting Pneumonia mortality rates above 19% (see Figure 2). Puerto Rico hospitals also compare unfavorably in Heart Attack and Heart Failure mortality rates.
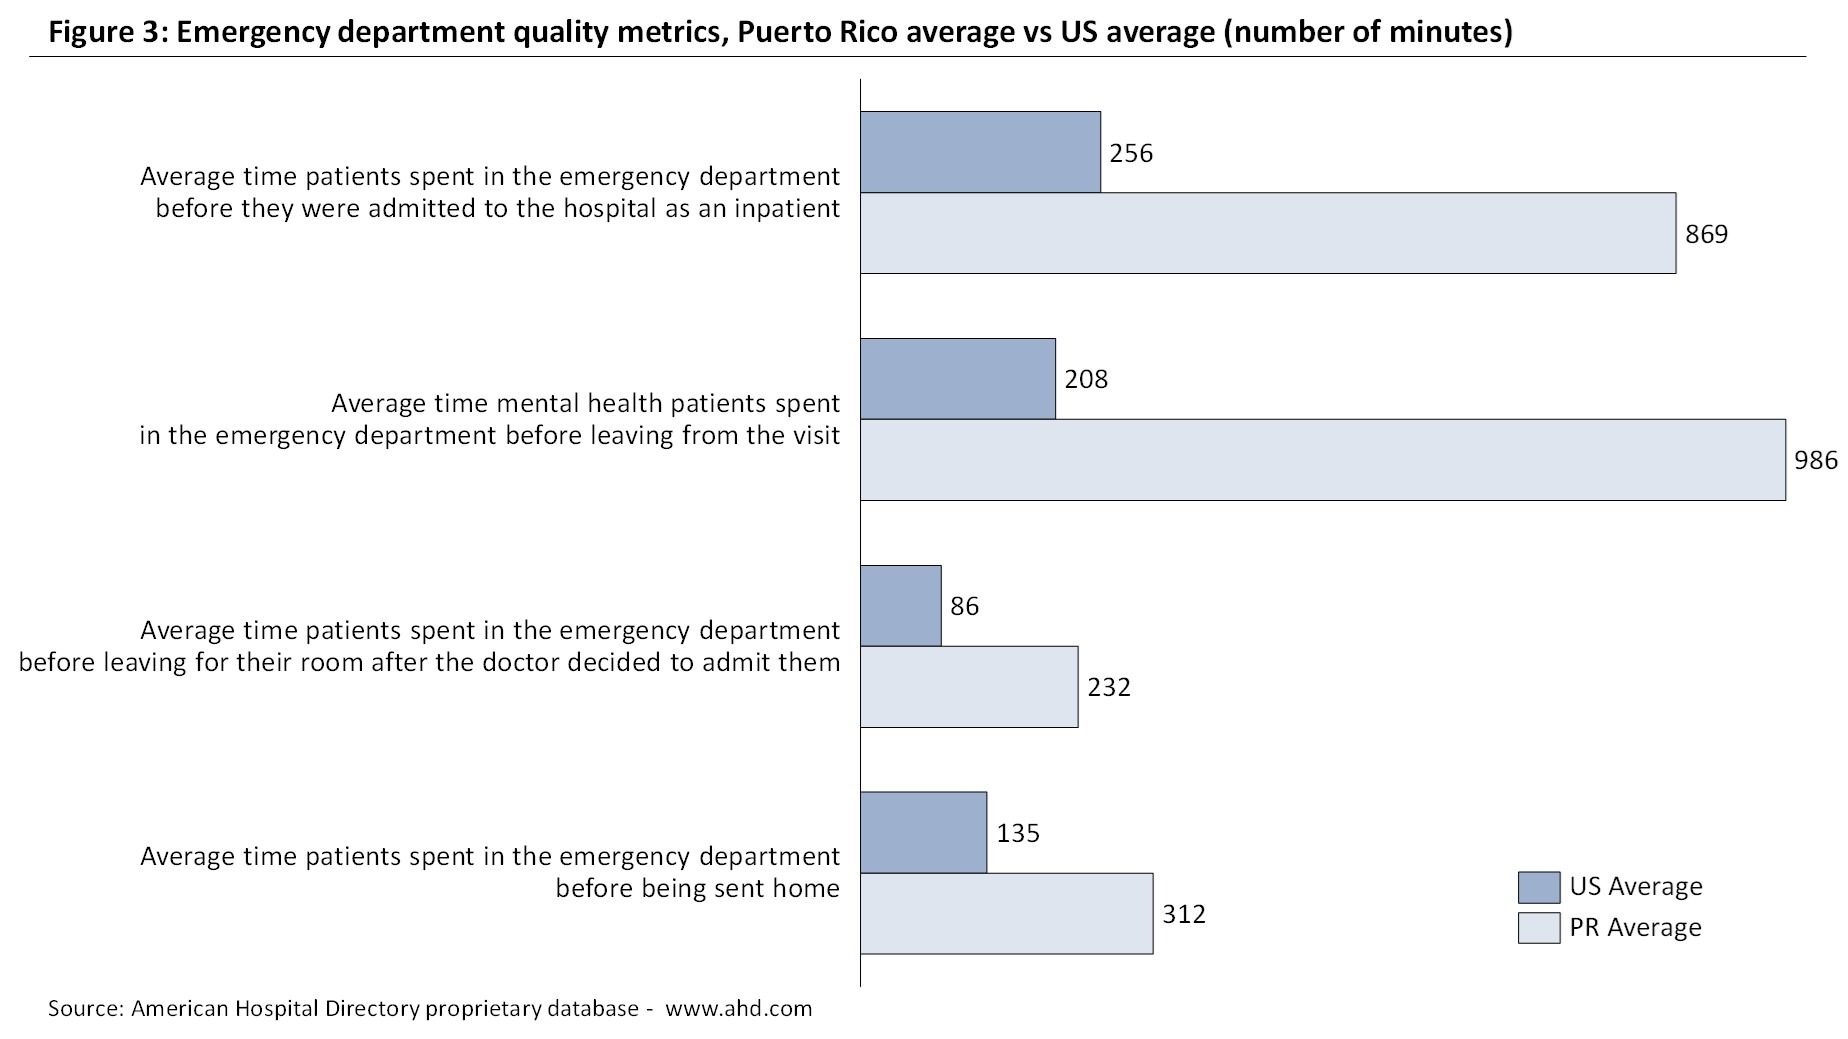
The disparity among Puerto Rico and US hospitals is perhaps most visible in the Emergency Department-related metrics (see Figure 3). For example, the average amount of time a patient spends in the ED before being admitted as an inpatient is roughly 4 hours and 18 minutes at the national level. In Puerto Rico, a patient waits approximately 14 hours and 30 minutes on average, almost three times the national average.
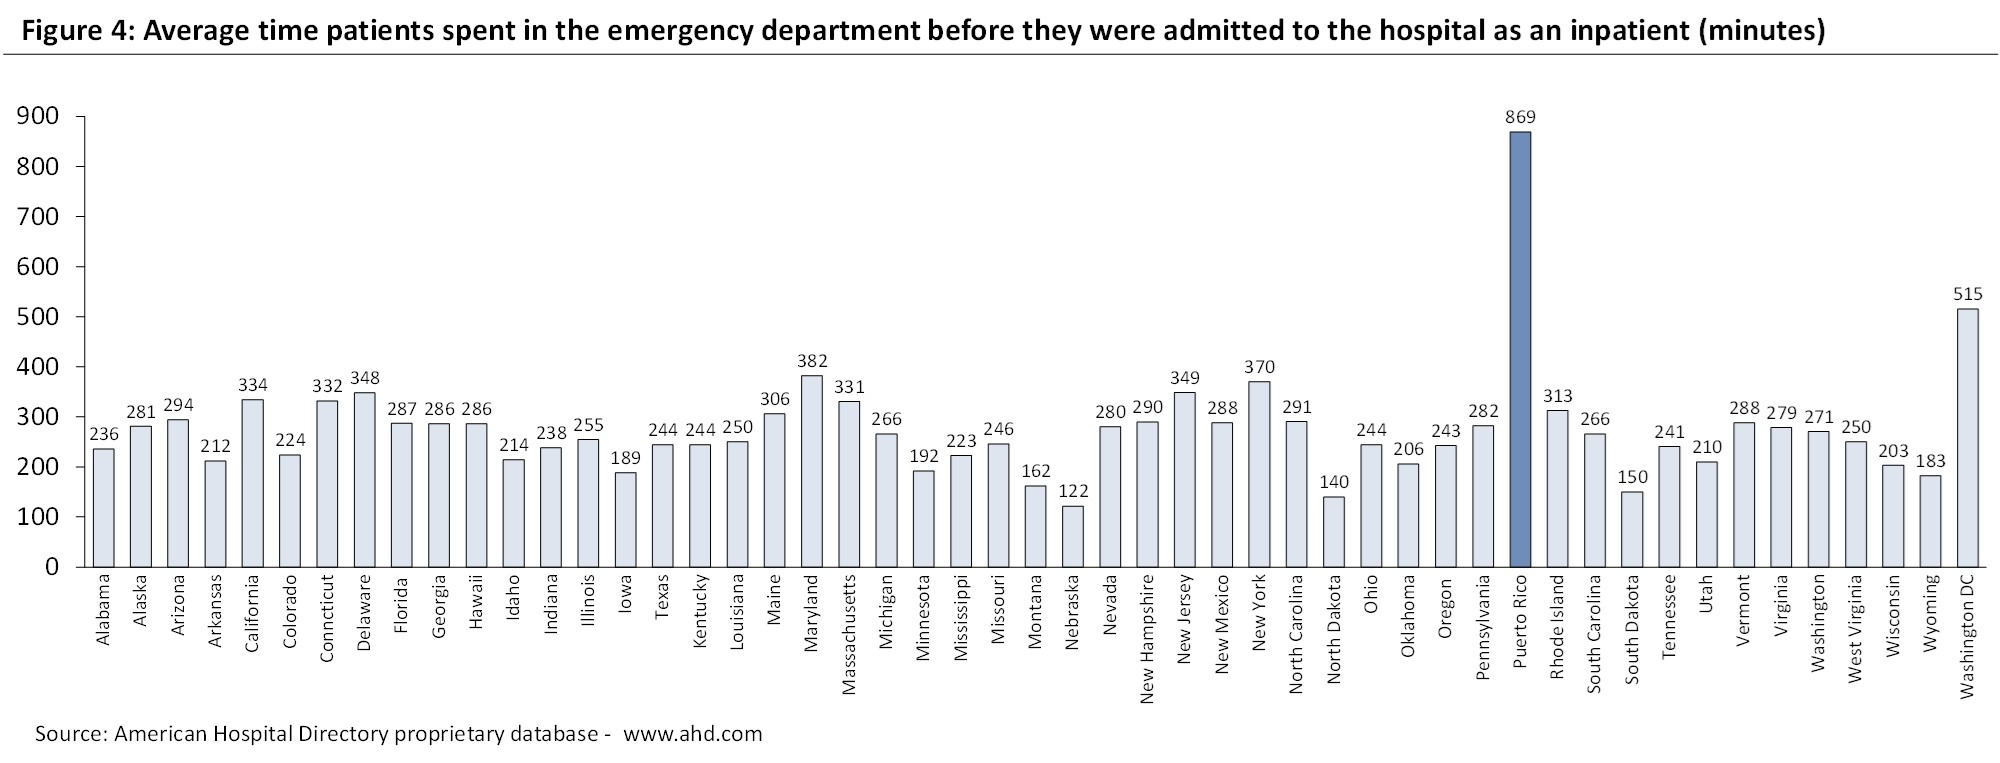
In Figure 4 we provide a comparison of this metric (time spent in the ED before being admitted to the hospital) between Puerto Rico and other States. Across State averages, Puerto Rico’ score is still remarkably salient. Though the average scores for 7 other States hover above the 300-minute mark, only 2 States surpass the 500-minute mark: Washington DC and Puerto Rico, with Puerto Rico well surpassing the 800-minute mark.
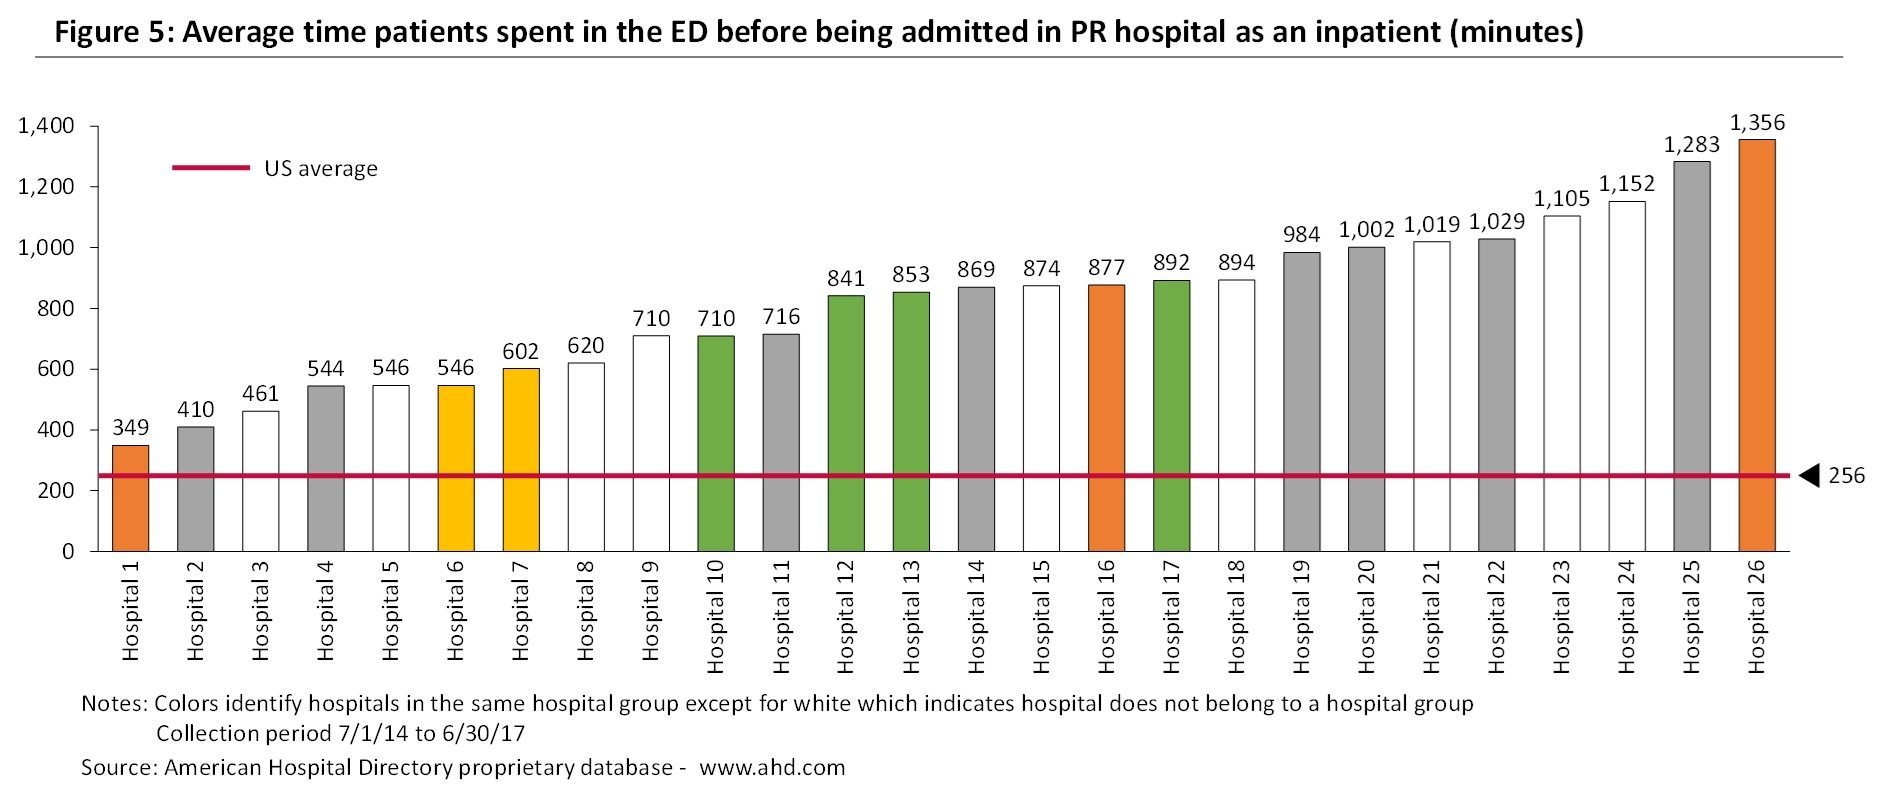
As can be observed in Figure 5, the 26 Puerto Rico hospitals that report this metric show longer waiting times than the US average (4 hours and 16 minutes). Additionally, we observe a lot of variability among Puerto Rico hospitals. There are six hospitals in which patients wait less than six hours while, on the opposite side, there are 8 hospitals where patients wait, on average, more than 16 hours. Additionally, we see no correlation between the island’ hospital management groups and emergency department performances. For instance, the two hospitals with the shorter and the longer waiting times in Figure 5 belong to the same hospital group.
As we will see in the next section, there are several root causes for the quality results of Puerto Rico hospitals vis a vis the US hospitals.
Factors driving the local hospitals quality performance
Possible causes for the aforementioned disparities may be linked to: 1) Excessive or unnecessary treatment at the ED level, 2) Lack of qualified professionals and/or resources available to hospitals, and 3) Overall system deficiencies in coordination of care. Let’ examine each of them:
Unnecessary ED visits represent care provided at an Emergency Department that could have been provided in a different point of care or avoided altogether. A high number of unnecessary ED visits creates an excessive load in a hospital’ workflow that affects wait time and potentially outcomes.
Based on the 2017 American Hospital Association Survey the number of emergency department visits per 1,000 population was 445 in the United States for the year 2017, ranging between 317 and 698 depending on the State. The Fiscal Plan for Puerto Rico as certified by the Financial Oversight and Management Board for Puerto Rico states that "Puerto Rican’ utilize the ED 3 times as often as peers on the U.S. mainland, with estimates as high as 90% of ER visits occurring for nonemergency care that could be treated in lower cost settings".
But which are the factors triggering higher levels of avoidable ED visits in Puerto Rico? Is it the lack of appropriate access to specialized and/or primary care physicians? Is it because patients pay less when treated in an ED? Do patients perceive the ED as a convenient one stop shop? Are there cultural aspects related to it? Whatever the reasons, hospitals and payers could work together to reduce the perverse incentives of patients to overutilize the ED.
Regarding the lack of qualified professionals, there are various industry analyses and news articles pointing to an exodus of Puerto Rican healthcare professionals during the past 15 years. For example, the Puerto Rico Institute of Statistics estimated that between 2005 and 2013, over 1,200 physicians and surgeons left Puerto Rico to live in the mainland US2. Similarly, the "Colegio de Médicos Cirujanos de Puerto Rico" (CMCPR) estimated an outmigration of 5,000 doctors between 2006 and 20163. In March of 2018, the CMCPR stated that approximately 14,000 doctors had left Puerto Rico in the previous 3 years, partly as a result of the impact of hurricane María4.
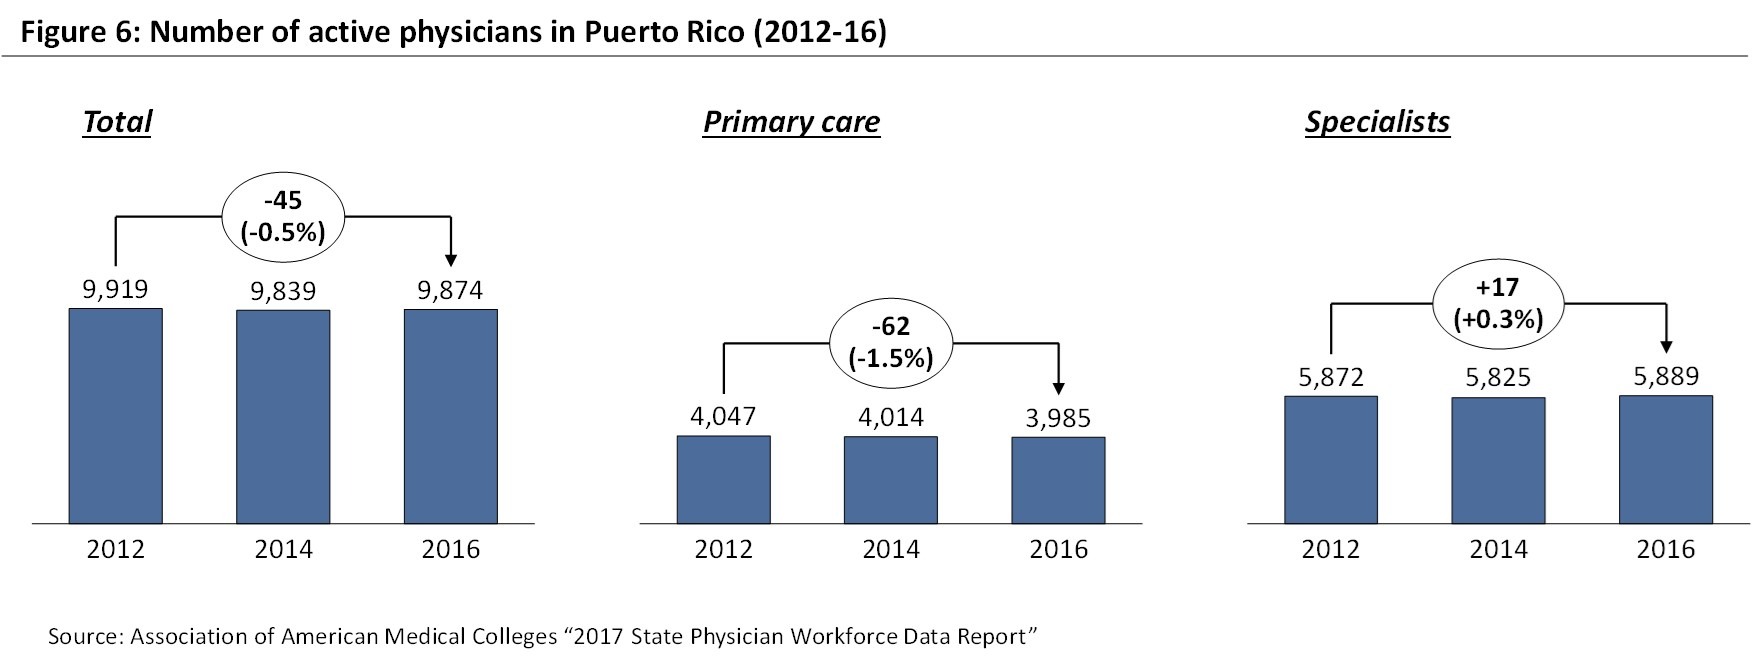
The numbers published by the Association of American Medical Colleges do not show such a dramatic scenario, at least for the period 2012-16. As can be observed in Figure 6, the number of total active physicians and active specialists has remained quite stable between 2012 and 2016, reaching 9,874 and 5,889 in 2016, respectively. The number of active primary care physicians has decreased by 1.5% during that period.
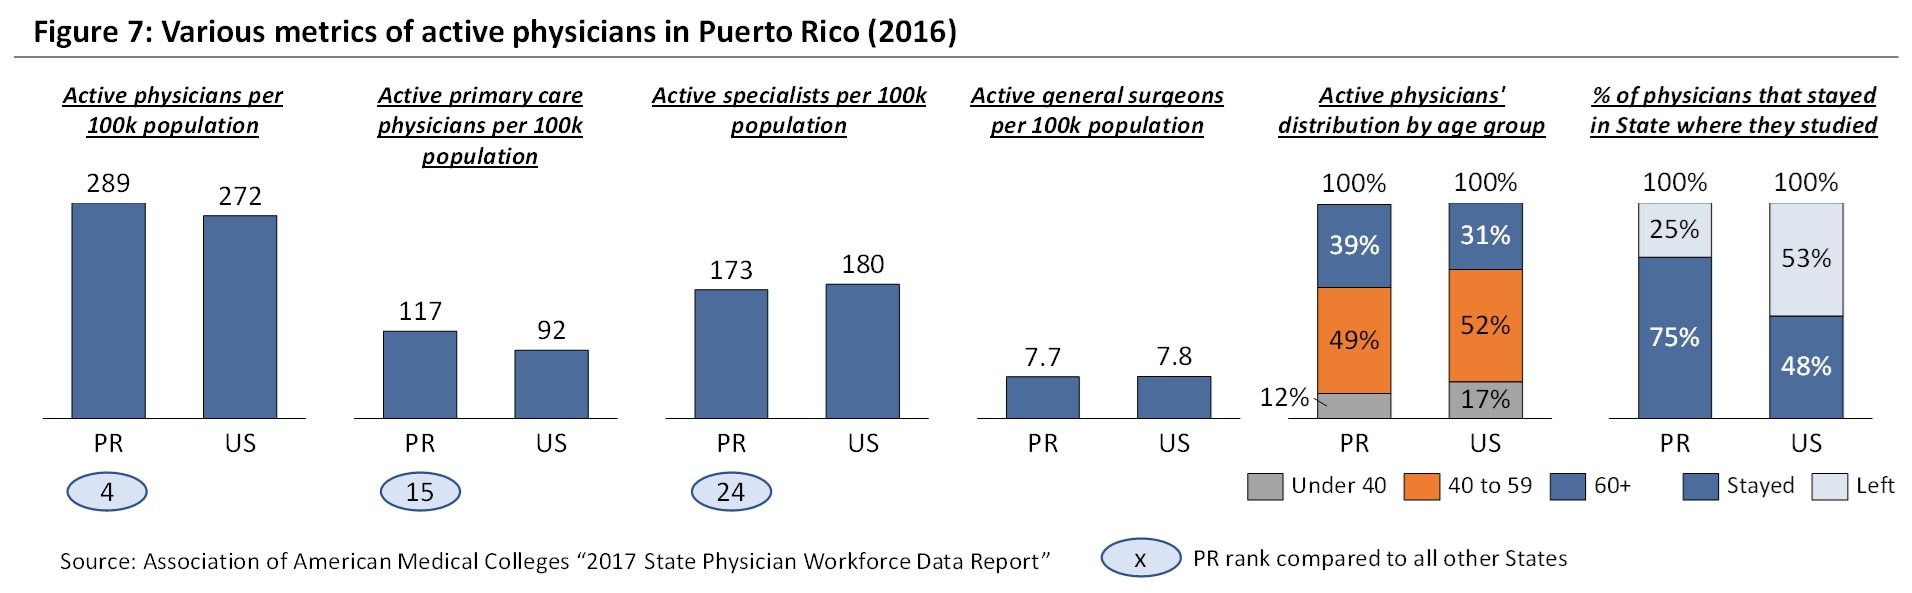
In Figure 7, we can observe how Puerto Rico had in 2016 more total and primary care physicians per 100 thousand population than the US, and it ranked 4 and 15 among US States, respectively. While Puerto Rico did show a lower ratio for active specialists, the gap against the US level was not large (173 vs 180 active specialists per 100 thousand population). Maybe more concerning is the larger concentration of doctors in the more than 60 years old category, which could translate into a reduction of practitioners as they retire if those retirements are not compensated with new graduates. On the other hand, and despite the salary differences against the US mainland, Puerto Rico retains a much larger portion of its graduates than the rest of the States (75% vs 48%).
While on a consolidated level there seems to be a comparable number of active specialists per 100 thousand population, there is a clear lack of physicians in certain specializations. As can be observed in Figure 8, the number of emergency physicians per 100 thousand population is below the worst State. Something similar happens with neurosurgeons, orthopedists and hand surgeon specialists, and ENT specialists. While this data is based on the "America’ Emergency Care Environment, A State by State Report Card" performed by the American College of Emergency Physicians in 2014, this situation has probably deteriorated further after hurricane María. Finally, the number of registered nurses per 100 thousand population is also significantly lower than the US benchmark (494 vs 942) and even below the State with the lowest ratio.

In summary, the quality metrics of local hospitals seem to be impacted by the scarcity of various types of specialists, particularly emergency physicians, as well as nursing staff. Hurricane María has probably worsened this situation further.
The lack of resources is exacerbated by the financial difficulties of local hospitals. As mentioned in a previous insight5, 44% of hospitals in Puerto Rico reported negative income margin results for the 2017-2018 period. Is the financial performance of the Puerto Rico hospital sector driven by the current reimbursement system? In other words, are low reimbursement rates the main driver behind poor financial performance and, as a consequence, limited resources and low-quality outcomes? Are there opportunities to improve the hospitals’ capital structure so that regulatory demands and patient expectations can be met?
Finally, the lack of an integrated health delivery system translates into a suboptimal coordination of care by the various providers in the healthcare system. As a result of this lack of integration and despite government efforts to build a Health Information Exchange, patients’ health history is still scattered across different organizations, providers and industries (e.g. hospitals, physician offices, insurance providers), best practices are not shared, and patients are not directed to the optimal care center. How might hospitals, doctors and payers improve their information sharing practices to meet high quality standards?
Concluding remarks
Puerto Rico hospitals show, in general, higher readmission and mortality rates than their peers in the United States. Additionally, their patients have to stay longer in the ED waiting for a doctor first and then for a room after the doctor decides to admit them. As we have shown, several factors that are external to hospitals including a shortage of qualified professionals and of other resources, the particular Medicare and Medicaid reimbursement guidelines for Puerto Rico, and the limited care coordination between the health sector participants are contributing to poor quality results.
Looking forward, hospitals are likely to feel more pressure to improve their quality results from the patient community and from the CMS itself. CMS is pushing for greater visibility in terms of hospital performance across the United States through a star rating system where quality is a key component. Furthermore, through the Quality Payment Program (QPP) that started in January 1st of 2017, CMS is moving payment to physicians and other eligible clinicians away from fee-for-service reimbursement, and instead pay them based on the quality and cost of care. It is not clear whether doctors and doctor groups in Puerto Rico are prepared for the gradual but imminent compliance with those guidelines and avoid lower reimbursement levels. If they are not, hospitals will also suffer the consequences.
Notes
Sources
1American Hospital Directory proprietary database - www.ahd.com. Not all Puerto Rico hospitals report all quality metrics. Therefore the number of reporting hospitals varies for each metric (e.g. 41 hospitals with readmission rate data, 23 hospitals with Pneumonia mortality rate data, 26 hospitals with average time spent in the ED before being admitted data).
2 NBC news - https://www.nbcnews.com/news/latino/puerto-rico-s-exodus-doctors-adds-health-care-strain-dire-n783776
3 "Caribbean Business" - https://cb.pr/imparable-la-fuga-de-medicos-en-puerto-rico/
4 "El Nuevo Día"- http://www.colegiomedicopr.org/peligrosa-fuga-de-miles-de-medicos/
5V2A Insight: Difficult times for the hospital sector in Puerto Rico - http://www.v2aconsulting.com/news-detail/128-137-difficult-times-for-the-hospital-sector-in-puerto-rico/
Disclaimer
Accuracy and Currency of Information: Information throughout this "Insight" is obtained from sources which we believe are reliable, but we do not warrant or guarantee the timeliness or accuracy of this information. While the information is considered to be true and correct at the date of publication, changes in circumstances after the time of publication may impact the accuracy of the information. The information may change without notice and V2A is not in any way liable for the accuracy of any information printed and stored, or in any way interpreted and used by a user.