 Coral Frederique Guzmán
 Private: Joaquín Rodríguez Kierce
Overview
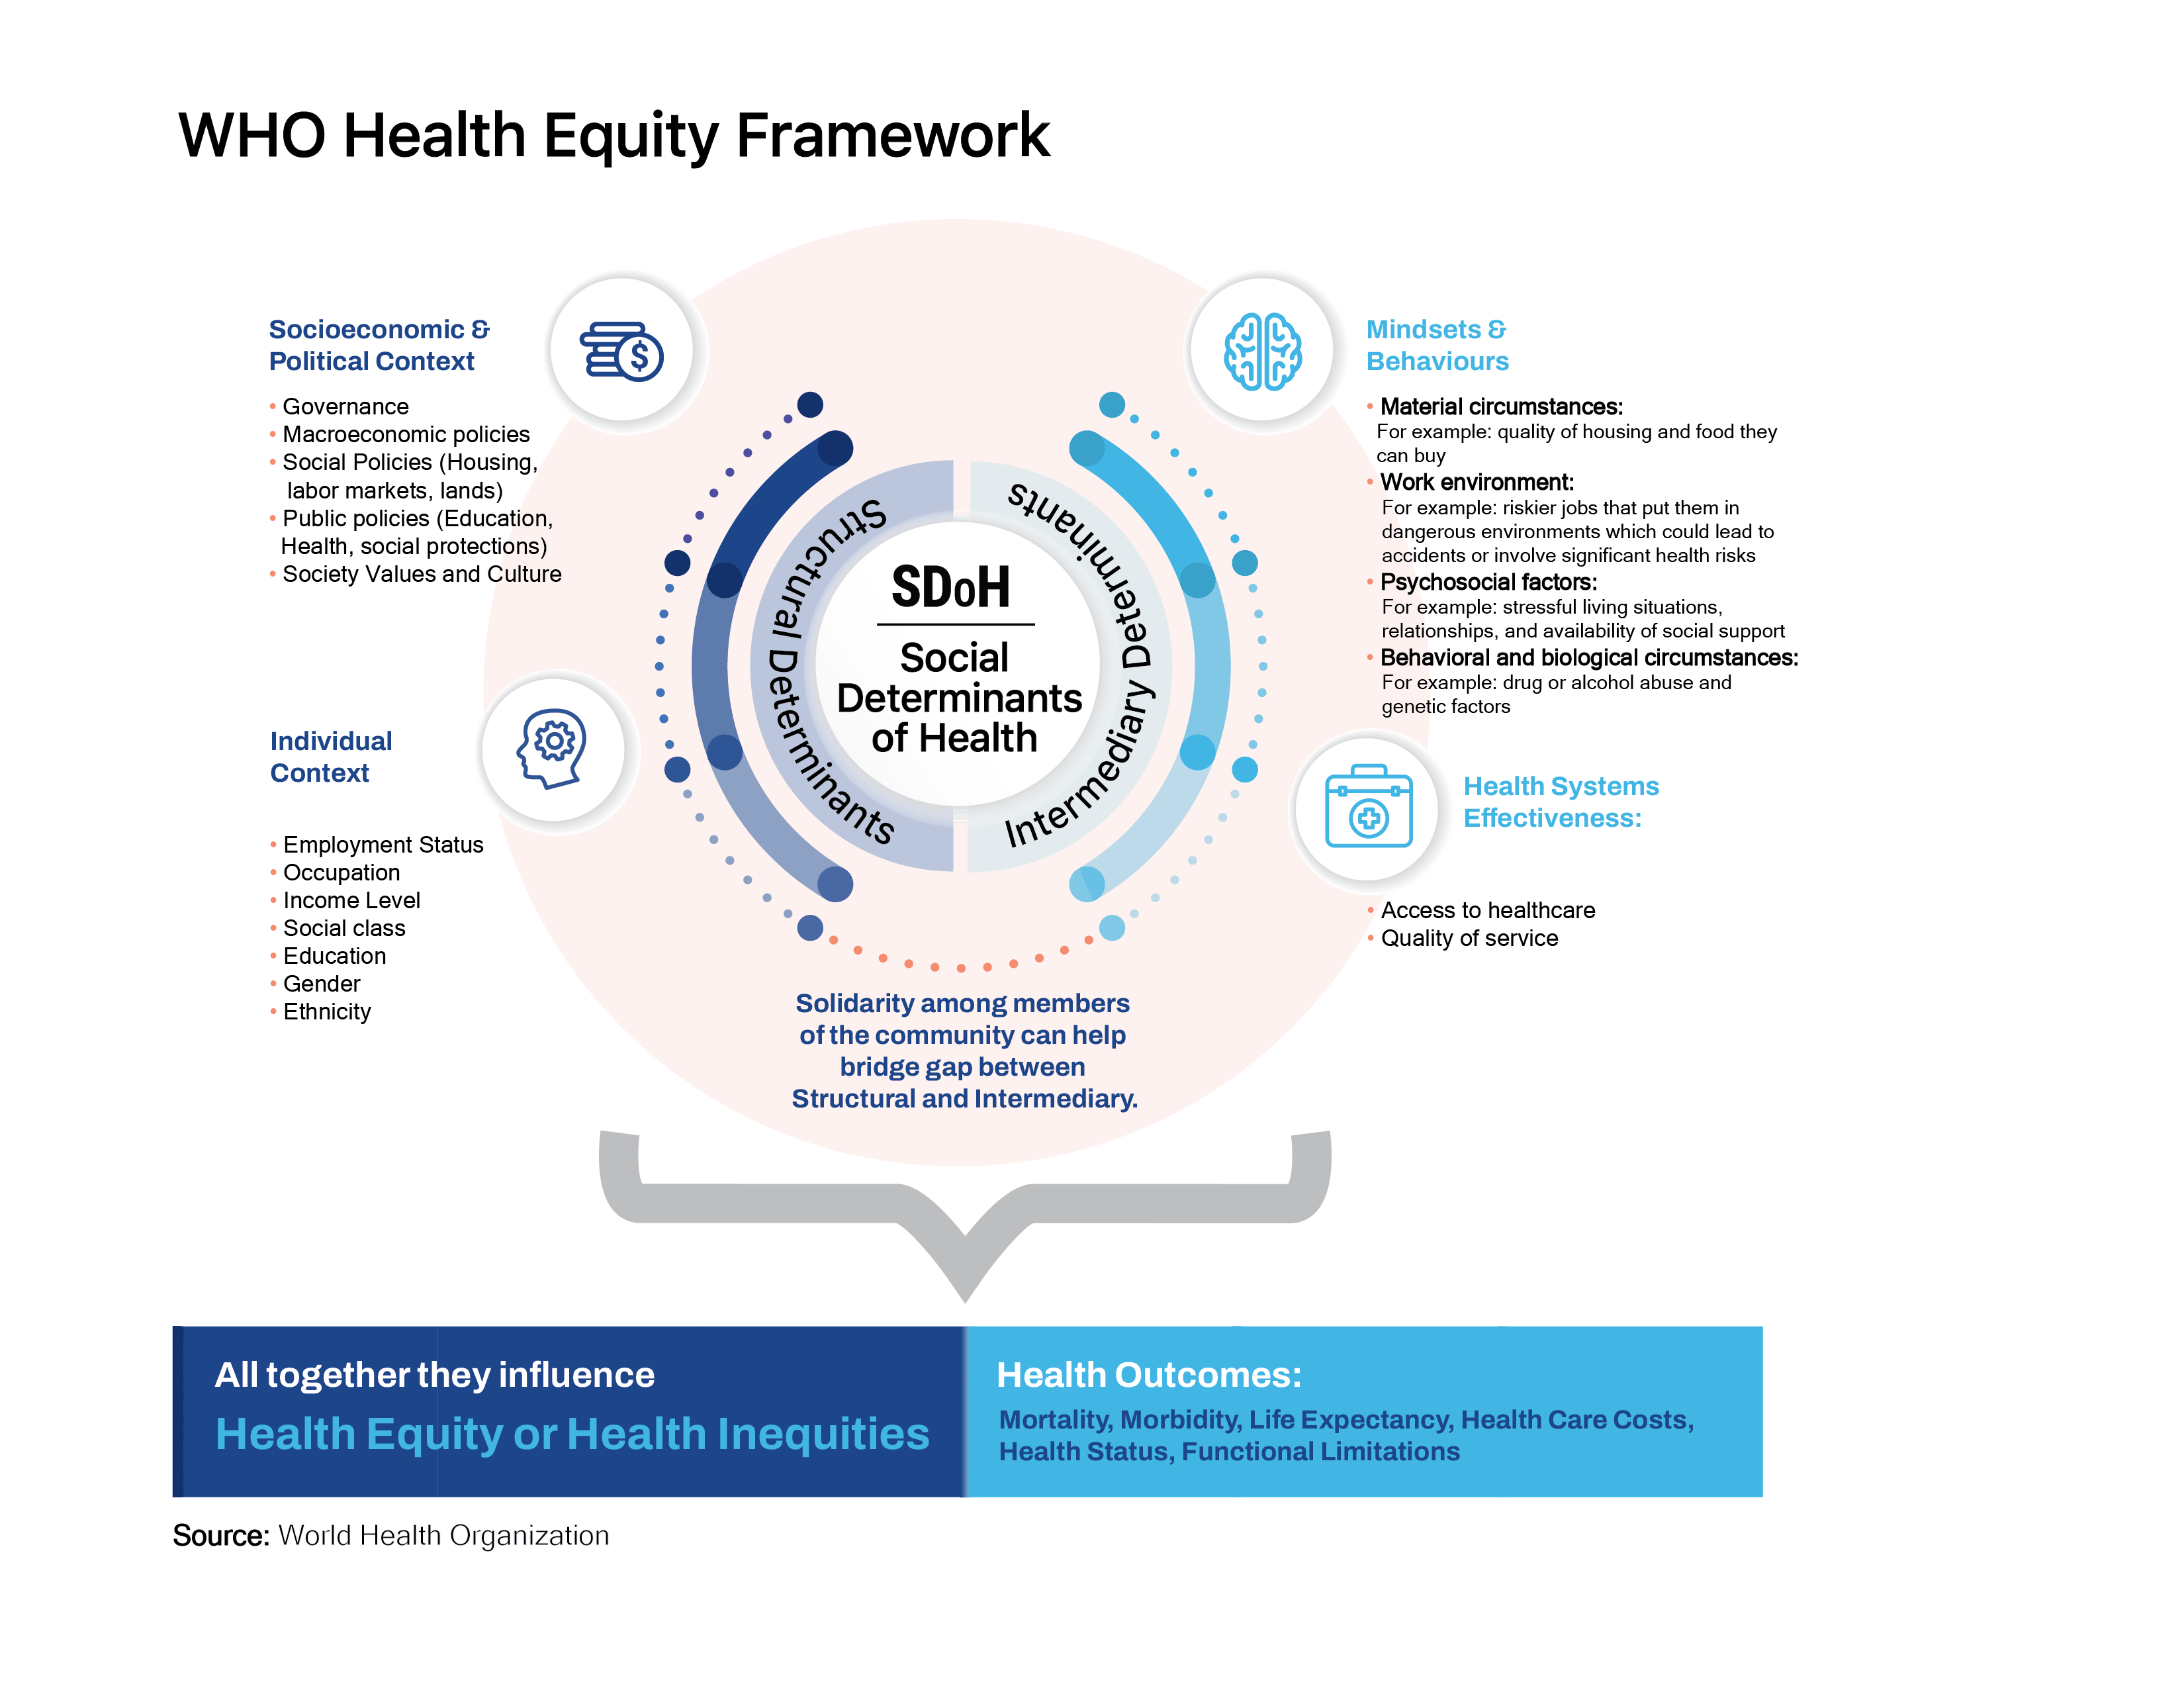
In recent years, most healthcare conversations have been sprinkled with terms like “health disparities,” “health inequalities,” or “health equity.” Per the World Health Organization (WHO), health equity is defined as the absence of unfair and avoidable or remediable differences in health among population groups. Health Equity is achieved when everyone can attain their full potential for health and well-being. [1] ] In contrast, Health Disparities arise when social and economic factors adversely influence the health outcomes of vulnerable groups within the population. These factors are collectively known as the Social Determinants of Health (SDoH) and are traditionally defined as the conditions in which people are born, grow, work, live, and age that shape their health. [2]
To address health disparities, we first need to understand why they exist. In Figure 1, we have illustrated the WHO framework that best explains how different SDoH interconnect across many levels with complex interactions between them. Put simply; health disparities result from structural determinants such as the socioeconomic and political context of where the person lives, which likely determine the socioeconomic context of the individual (income level, occupation, education). Structural determinants can shape, influence, or interact in linear and nonlinear ways with intermediary determinants such as individual behaviors and available healthcare infrastructure, and all together, they influence an individual’s health outcomes.
FIGURE 1
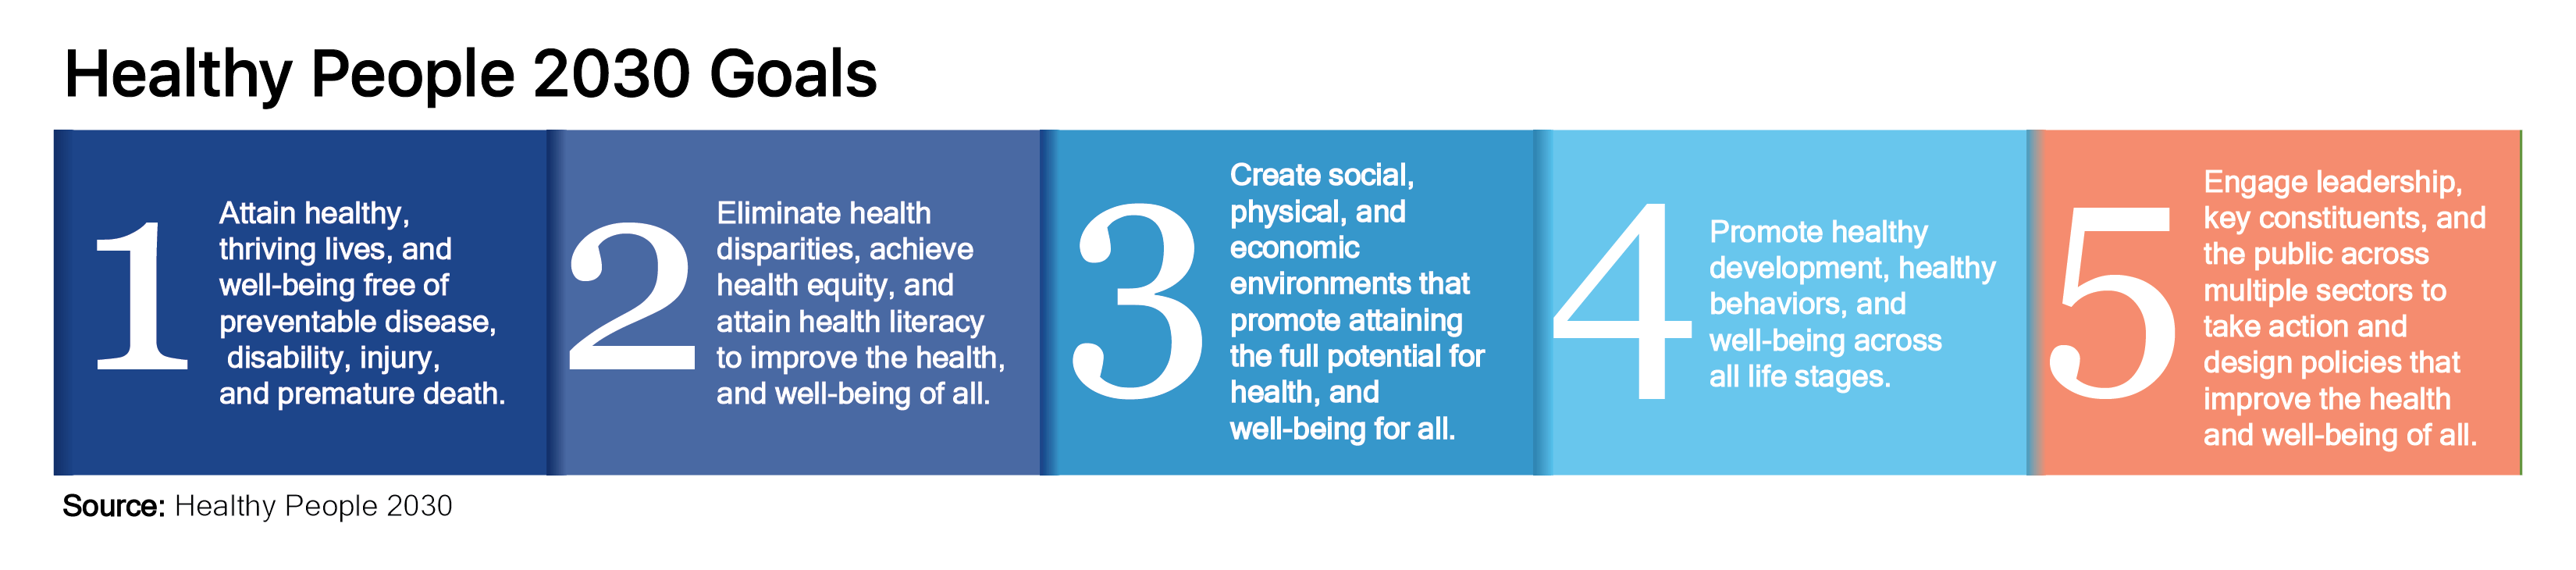
 In 1980 the US federal government launched Healthy People, a national initiative to improve the US population’s health and well-being. It did this by setting science-based goals and measurable objectives that were reviewed, updated, and used by the federal government, states, communities, and many other public and private organizations to monitor progress and target, mitigate, and prevent health problems. At the beginning of every decade, a new iteration of the initiative is launched that addresses the latest public health priorities and challenges. Healthy People 2030 is the initiative’s fifth iteration and prioritizes addressing health disparities head-on to advance health equity.
FIGURE 2
The US Department of Health and Human Services, through the Healthy People 2030 initiative, has grouped SDoH into five main categories to measure and track the progress in advancing health equity (Figure 3 below). Here at V2A, we will follow this categorization on all SDoH initiatives going forward.
FIGURE 3
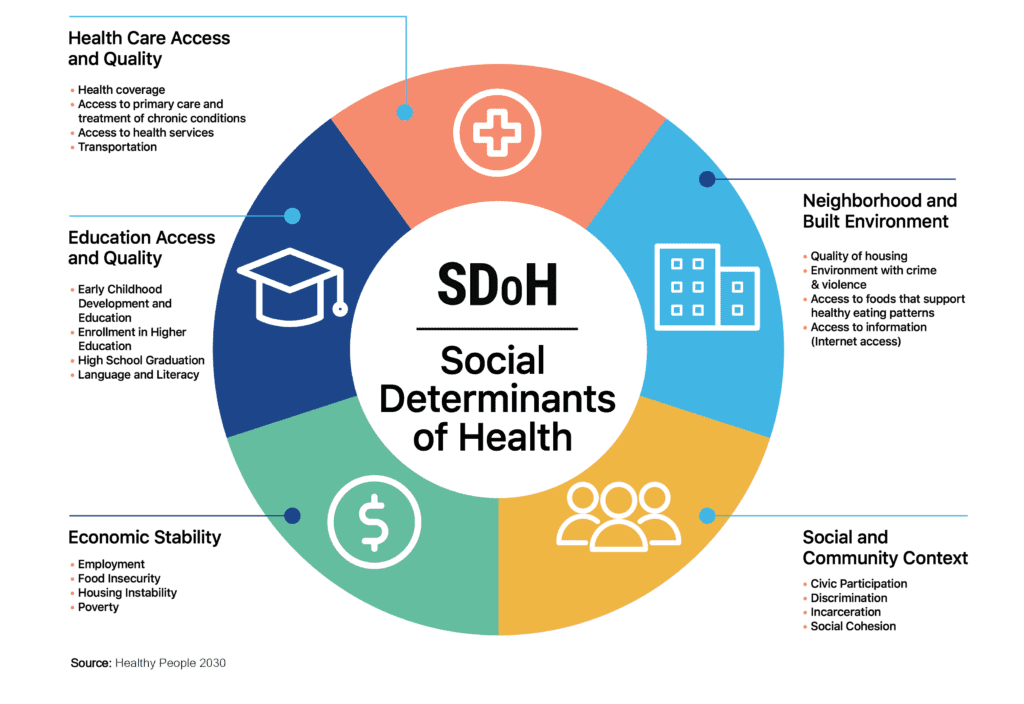
- Economic Stability: Poverty is linked to poor health outcomes due to reduced access to resources that are needed to support a healthy quality of life, such as stable housing, food security, safe neighborhoods, and access to educational and employment opportunities. In Puerto Rico, the percentage of the population that’s living below the federal poverty level is 43.50% compared to, on average, 12.30% stateside. [3] Minorities, immigrants, people living in rural areas, and people with disabilities tend to have higher levels of poverty, which is linked to increased risk for mental illness, chronic disease, and higher mortality. [5-8] In the US, life expectancy differences between the richest 1% and poorest 1% of individuals is, on average, 14.6 years for men and 10.1 years for women. [9] Puerto Rico’s population has a higher incidence of chronic conditions like diabetes and hypertension (see figure 4 below).
FIGURE 4

- Education Access and Quality: Not completing high school is linked to limited employment prospects, low wages, and poverty. [11-12] As noted in the economic stability category, these are all important determinants of health. Individuals who do not complete a high school degree more frequently report suffering from at least one chronic health condition — for example, asthma, diabetes, heart disease, high blood pressure, stroke, hepatitis, or stomach ulcers — than graduates. [13-14] Overall, the higher the level of education, the lower the risk of premature death and the greater employment prospects and lifelong earning potential. [15] In Puerto Rico, the percentage of the population with no high school diploma is 21% compared to 11.4% in the mainland US. [3]
Another very important SDoH that falls into this category and has gained more importance in the recent decade is health literacy. When individuals have limited personal health literacy, they are at higher risk of misunderstanding information that is important to attaining and maintaining health or losing their way in the fragmented healthcare system. Health Literacy is the degree to which individuals can find, understand, and use information and services to inform health-related decisions and actions for themselves and others. [26] Personal health literacy is associated with racial/ethnic minority status, age, poverty, health insurance coverage, educational attainment, language spoken before starting school, and self-reported health. [27] Strategies to increase personal health literacy are the focus of Healthy People 2030 as a foundational principle and overarching goal since they will largely benefit populations that have been historically marginalized and therefore have the potential to meaningfully lessen health disparities.
- Health Care Access and Quality: Health insurance status is one of the strongest predictors of access to preventive services and health care. Overall, uninsured adults experience worst health outcomes than insured adults, particularly when suffering from chronic diseases, such as cardiovascular disease or diabetes. For example, a recent study showed that uninsured diabetic patients have 60% fewer doctor office visits, are prescribed 52% fewer medications, and have 168% more emergency department visits when compared to insured diabetic patients. [16] In the US, about 1 in 10 people don’t have health insurance, and vulnerable groups such as people with lower income and minorities are at higher risk of having no health insurance or inadequate health insurance coverage. [17] Because almost half of Puerto Rico’s population gets their healthcare coverage through the Medicaid program, the percentage of the population with no coverage is 6%.[3] However, as published in our 2021 Medicaid Funding for Puerto Rico insight, given our territory status, our Medicaid funding is capped, resulting in a lower quality of healthcare infrastructure and services and less coverage for Medicaid mandatory and optional benefits. High poverty levels in Puerto Rico result in a population with lower purchasing power to acquire individual health coverage, making the Medicaid Funding Gap issue one of the most important ones to resolve at a federal and local level.
- Neighborhood and Built Environment: The neighborhoods people live in have a major impact on their health and well-being. One key variable is the accessibility and availability of foods that support healthy dietary patterns. For example, a city or neighborhood urban planning and permitting process can impact the accessibility and quality of food options and reduce the creation of “food deserts.” Distance to grocery stores and lack of transportation can also be barriers that inhibit access to healthy food options. Studies have shown that residents of neighborhoods with fewer fresh produce sources and plentiful fast-food restaurants and convenience stores were at a higher risk of obesity and diabetes than residents in neighborhoods with access to healthy foods and a higher density of full-service restaurants and grocery stores [20-21]. Access to green spaces, public transport, and level of physical activity are also important environment determinants that play an important part in health outcomes and can be influenced by policy/urban planning decisions.
- Social and Community Context: People’s relationships and interactions with family, friends, co-workers, and community members can have a major impact on their health and well-being. Many people face challenges and dangers they can’t control — like unsafe neighborhoods, discrimination, or difficulties affording the necessary things. This can have a negative impact on health and safety throughout life. A clear example would be the discrimination towards African Americans and Hispanic people who are disproportionality arrested and convicted for offenses. When compared to the general population, men and women with a history of incarceration are in worse mental and physical health. Studies have shown that when compared to the general population, people of both sexes who are incarcerated are more likely to have high blood pressure, asthma, cancer, arthritis, and infectious diseases, such as tuberculosis, hepatitis C, and HIV. [22-25]
The road to achieving health equity
The federal government, through the Centers for Medicare & Medicaid Services (CMS) has outlined five priorities needed by 2032 to achieve health equity and eliminate disparities. Priority 1 is to expand the collection, reporting, and analysis of standardized data. Priority 2 is to assess the causes of disparities within CMS programs and address inequities in policies and operations to close gaps. Priority 3 is to build the capacity of healthcare organizations and the workforce to reduce health and healthcare disparities. Priority 4 is to advance language access, health literacy, and the provision of culturally tailored services. Priority 5 is to increase all forms of accessibility to health care services and coverage.
FIGURE 5

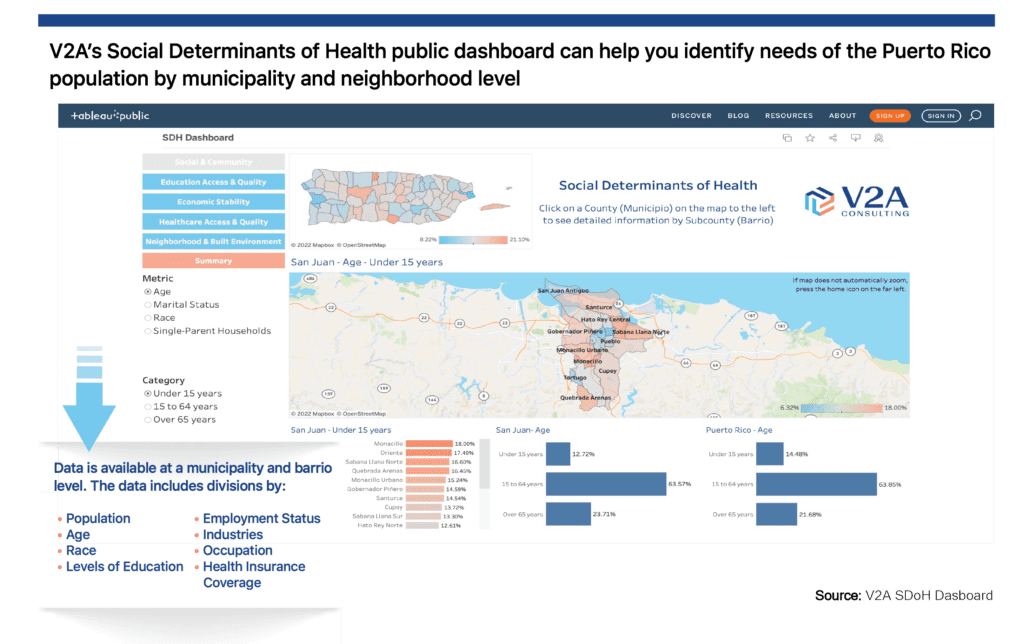
Consistent with CMS priorities one and two, V2A has started working on ways to support private and public stakeholders on their strategies to meet federal government mandates. We have published public access to our Social Determinants of Health Dashboard, developed to help identify the needs of the Puerto Rico population at municipality and neighborhood levels. As of now, the V2A SDoH Dashboard includes data for population, demographic, age, race, educational attainment, employment, poverty, occupation, industry, transportation (number of vehicles in a household), housing (plumbing and kitchen facilities), internet access, rent to a mortgage payment on annual income (by range), families with widowed and separated parents, families with "single-parent," families with some type of disability and health insurance coverage by type of payor … all visualized as a Puerto Rico heat map.
FIGURE 6
V2A’s Healthcare Practice will continue gathering Puerto Rico health-related data to periodically review and expand our public dashboard and analyze and develop insights to promote data-driven conversations between industry stakeholders and policymakers. We are looking to partner with local and central governments as well as private health and nonprofit sectors to generate and publish insights that will support initiatives to improve Puerto Rico’s health outcomes to achieve health equity. We believe local governments have a vital role in collecting information on the social determinants of health in their communities and addressing issues related to access to health services, disease prevention, health education, and rehabilitation. Moreover, we understand that the private sector ought to collaborate with the public sector to improve and maximize the effectiveness of its clinical and social programs. V2A’s goal is to leverage data collection and analysis from all stakeholders to facilitate understanding and generate insights and collaborations that ultimately result in implementing initiatives that best reduce health disparities in Puerto Rico.
If you or your organization is interested in learning more about what our team is doing to help achieve Health Equity or want to collaborate, contact us at info@v2aconsulting.com
Sources:
[1] World Health Organization Social determinants of health (who.int)
[2] Center for Disease Control (CDC) About Social Determinants of Health (SDOH) (cdc.gov)
[3] V2A Economic Dashboard Puerto Rico Economic Dashboard – V2A (v2aconsulting.com)
[4] V2A Social Determinants of Health Dashboard
[5] Rank, M. R., & Hirschl, T. A. (2015). The likelihood of experiencing relative poverty over the life course. PloS ONE, 10(7), e0133513. https://doi.org/10.1371/journal.pone.0133513
[6] Singh, G. K., & Siahpush, M. (2006). Widening socioeconomic inequalities in US life expectancy, 1980–2000. International Journal of Epidemiology, 35(4), 969–979. https://doi.org/10.1093/ije/dyl083
[7] Belle, D., & Doucet, J. (2003). Poverty, inequality, and discrimination as sources of depression among U.S. women. Psychology of Women Quarterly, 27(2), 101–113. https://doi.org/10.1111/1471-6402.00090
[8] Cellini, S. R., McKernan, S. M., & Ratcliffe, C. (2008). The dynamics of poverty in the United States: A review of data, methods, and findings. Journal of Policy Analysis and Management, 27(3), 577–605. https://onlinelibrary.wiley.com/doi/abs/10.1002/pam.20337
[9] JAMA
[10] Hispanic Health | VitalSigns | CDC
[11] Ross, C. E., & Wu, C. L. (1995). The links between education and health. American Sociological Review, 719–745.
[12] Kawachi, I., Adler, N. E., & Dow, W. H. (2010). Money, schooling, and health: Mechanisms and causal evidence. Annals of the New York Academy of Sciences, 1186(1), 56–68.
[13] Freudenberg, N., & Ruglis, J. (2007). Reframing school dropout as a public health issue. Preventing Chronic Disease, 4(4), A107.
[14] Vaughn, M. G., Salas-Wright, C. P., & Maynard, B. R. (2014). Dropping out of school and chronic disease in the United States. Journal of Public Health, 22(3), 265–270.
[15] 21. Levin, H. M., Belfield, C., Muennig, P. A., & Rouse, C. (2007). The costs and benefits of an excellent education for all of America’s children. Teachers College, Columbia University.
[16] JAMA. 2007;298(24):2886-2894
[17] Berchick, E.R., Hood, E., & Barnett, J.C. (2018). Health Insurance Coverage in the United States: 2017. Retrieved from census.gov [PDF – 1.4 MB]
[18] Access to Foods That Support Healthy Dietary Patterns – Healthy People 2030 | health.gov
[19] Penney, T. L., Brown, H. E., Maguire, E. R., Kuhn, I., & Monsivais, P. (2015). Local food environment interventions to improve healthy food choice in adults: A systematic review and realist synthesis protocol. BMJ Open, 5(4), e007161. Doi: 10.1136/bmjopen-2014-007161
[20] California Center for Public Health Advocacy, PolicyLink, & UCLA Center for Health Policy Research. (2008). Designed for disease: The link between local food environments and obesity and diabetes. https://healthpolicy.ucla.edu/publications/Documents/PDF/Designed%20for%20Disease%20The%20Link%20Between%20Local%20Food%20Environments%20and%20Obesity%20and%20Diabetes.pdf
[21] Ahern, M., Brown, C., & Dukas, S. (2011). A national study of the association between food environments and county‐level health outcomes. Journal of Rural Health, 27(4), 367–379. Doi: 10.1111/j.1748-0361.2011.00378.x
[22] Binswanger, I. A., Krueger, P. M., & Steiner, J. F. (2009). Prevalence of chronic medical conditions among jail and prison inmates in the United States compared with the general population. Journal of Epidemiology and Community Health, 63(11), 912–919.
[24] Maruschak, L. M., & Beavers, R. (2009). HIV in prisons, 2007–08. Bureau of Justice Statistics Bulletin.
[25] Spaulding, A. C., Seals, R. M., Page, M. J., Brzozowski, A. K., Rhodes, W., & Hammett, T. M. (2009). HIV/AIDS among inmates of and releasees from US correctional facilities, 2006: Declining share of epidemic but persistent public health opportunity. PloS One, 4(11).
[26] Health Literacy - Healthy People 2030 | health.gov
[27] Kutner, M., Greenburg, E., Jin, Y., & Paulsen, C. (2006). The health literacy of America’s adults: Results from the 2003 National Assessment of Adult Literacy (NCES 2006-483). Institute of Education Sciences, National Center for Education Statistics.
Disclaimer
Accuracy and Currency of Information: Information throughout this “Insight” is obtained from sources that we believe are reliable, but we do not warrant or guarantee the timeliness or accuracy of this information. While the information is considered accurate and correct at the date of publication, changes in circumstances after the time of publication may impact the accuracy of the information. The information may change without notice, and V2A is not liable for the accuracy of any information printed and stored or interpreted and used by a user.
ONLY ENGLISH VERSION