 2018 was an excellent year for the profitability of banks in Puerto Rico. At the industry level, Pre-Tax ROE reached 14%, aligned with the US banking industry profitability levels for the first time in ten years. We expect this trend to continue in 2019 since most of the profitability levers seem to be moving in the right direction.
The United States (US) and Puerto Rican (PR) economies have shown very different trends since the 2008 financial crisis. While the US economy was already growing in 2010 and has continued expanding since then, the local economy has experienced a prolonged economic downturn that has extended through fiscal 2018, and perhaps beyond. As a consequence, the local and mainland banking sectors have also shown diverging performance trends in the past decade. As can be observed in Figure 1, the local banking industry has consistently reported lower profitability levels than its peers in the US after 2008. The gap was largest in years 2010 and 2013, and fluctuated between 7.5 and 9.7 percentage points during the 2014-17 period.
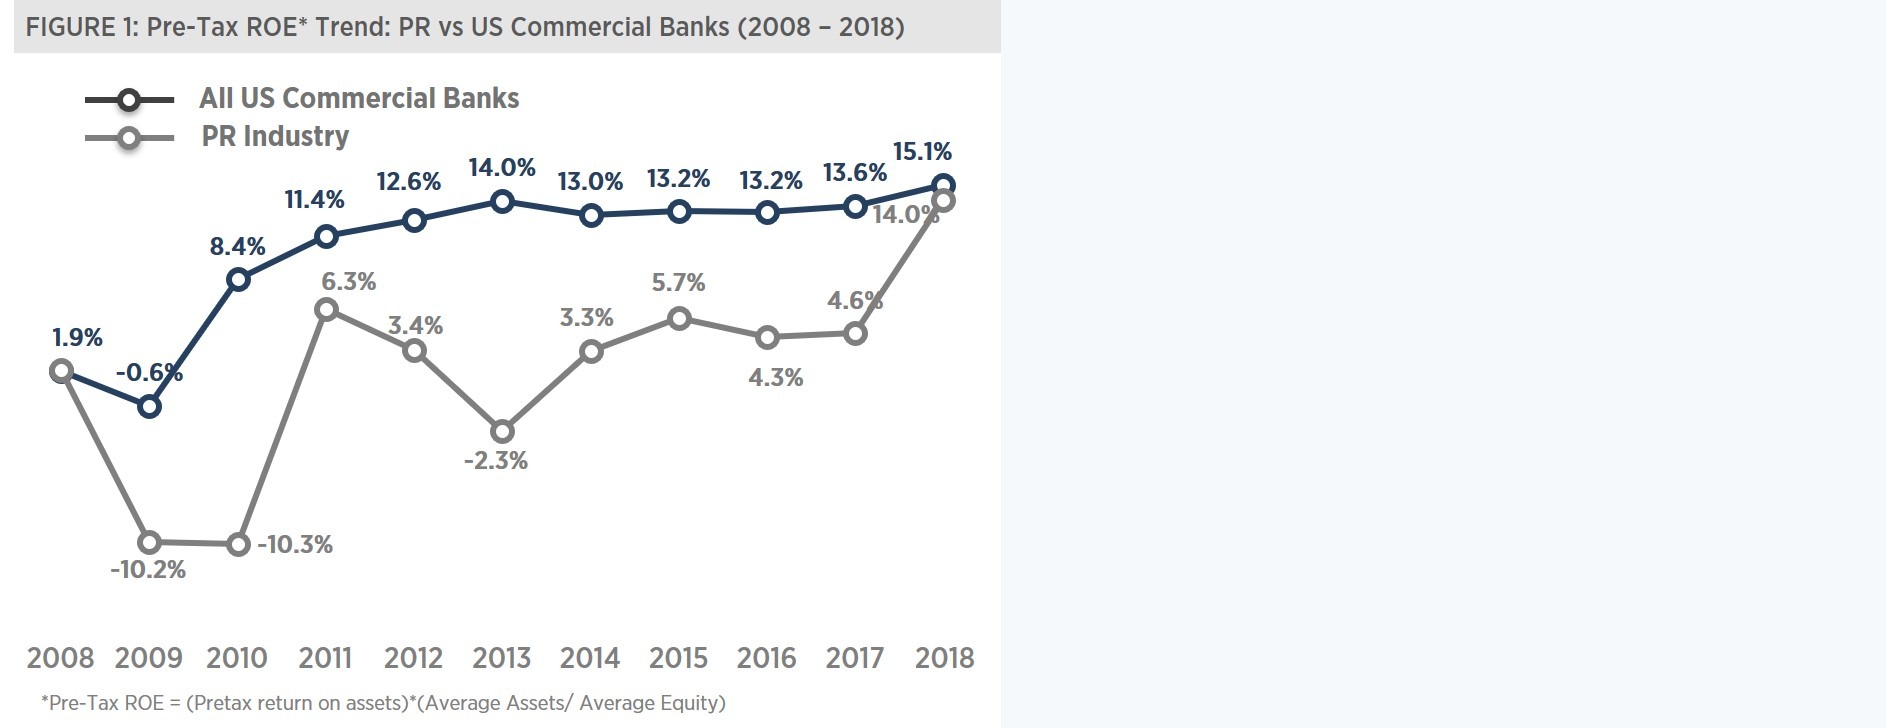
However, efforts made by local banks to improve asset quality, mitigate risk, increase economies of scale (mainly through consolidation), and identify other efficiencies is paying off. The PR banking sector Pre-Tax ROE reached double digit levels in 2018 (14.0%) for the first time since 2006 and was very close to the US benchmark of 15.1%. This improvement was shared by all banks in PR but was particularly felt by Oriental Bank (14.0% 2018 Pre-Tax ROE) and Banco Popular (18.3% 2018 Pre-Tax ROE), with Popular even surpassing the US Benchmark.
Each local bank has its relative profitability strengths and areas of opportunity which are apparent when we compare their performance in various profitability levers against US peers. Figure 2 below provides a break-down of return on assets (ROA) into component ratios (i.e. income- and expense-to-assets ratios) for local banks and their comparable US peers. Green and red colors are used to point out when the different income and expense levers of local banks outperform or underperform their respective US peer groups.
Banco Popular and FirstBank are benchmarked against US commercial banks with assets between $10 and $250 billion, while Santander, Oriental Bank, and Scotiabank are compared with US commercial banks with assets between $1 and $10 billion.
When analyzing the interest income-to-assets ratio, local banks performed better than their US benchmarks in 2018 (see Figure 2). The higher interest income is not explained by the percent of loans and leases in the asset mix. The PR banks’ loan and lease percent of total assets is in line or below the US benchmarks depending on the bank. However, the loan and lease mix is significantly different. The consumer and mortgage portfolios, which generally involve higher interest rates than commercial loans, represent 60% of loans in PR compared to between 36% and 47% in the case of the US benchmarks. Another possible reason for the higher PR interest rates is the highly concentrated nature of the local banking sector, which reduces competitive pressures. Finally, another possible factor driving interest income differences could be the fixed vs variable interest loan mix, but we do not have enough data to assess the effect of this factor.
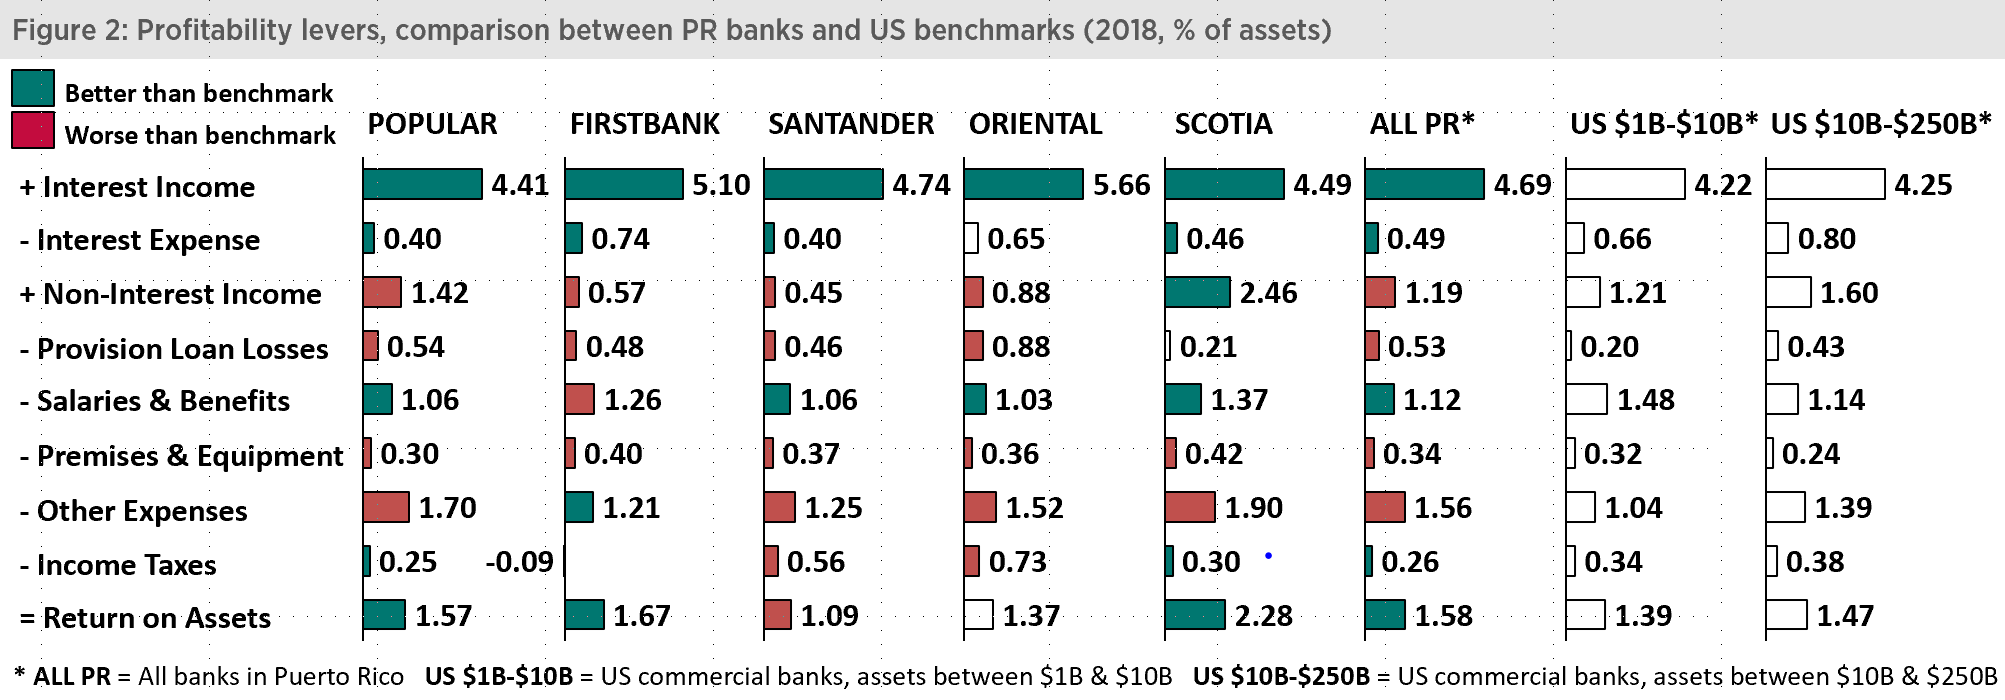
The second profitability component, interest expense-to-assets ratio, is lower for local banks when compared to their peers in the US. This confirms the conventional wisdom that in PR there is less competition for deposits, lowering funding costs for banks compared to their US peers. Furthermore, in PR it is not common practice to acquire certificates of deposits (CDs) from non-traditional sources or non-local depository institutions. If the local banking culture with regards to non-traditional CDs were to change, the interest expense-to-assets gap between US and PR could narrow.
The provision for loan losses-to-assets ratio is higher in PR, driven by the higher delinquency levels in the Island. Despite having decreased from 9.9% in 2014 to 6.8% in 2018, the non-current loans ratio* in the PR banking industry is still six times higher than the US benchmark. In terms of non-interest income, the US generally fares better than PR by either providing more fee-based services or by charging more for comparable services or products.
When analyzing noninterest expense components, as one might expect, we find salaries and benefits to be lower in PR than in the US. It should be noted that FirstBank and Scotiabank have higher salaries and benefits than their local peers, with salaries and benefits-to assets ratios of 1.26% and 1.37%, respectively, compared to a PR industry level of 1.12% (see Figure 2). The remaining components of noninterest expense, premises and equipment, and additional noninterest expense are materially higher in PR banks vis-à-vis their US peers.
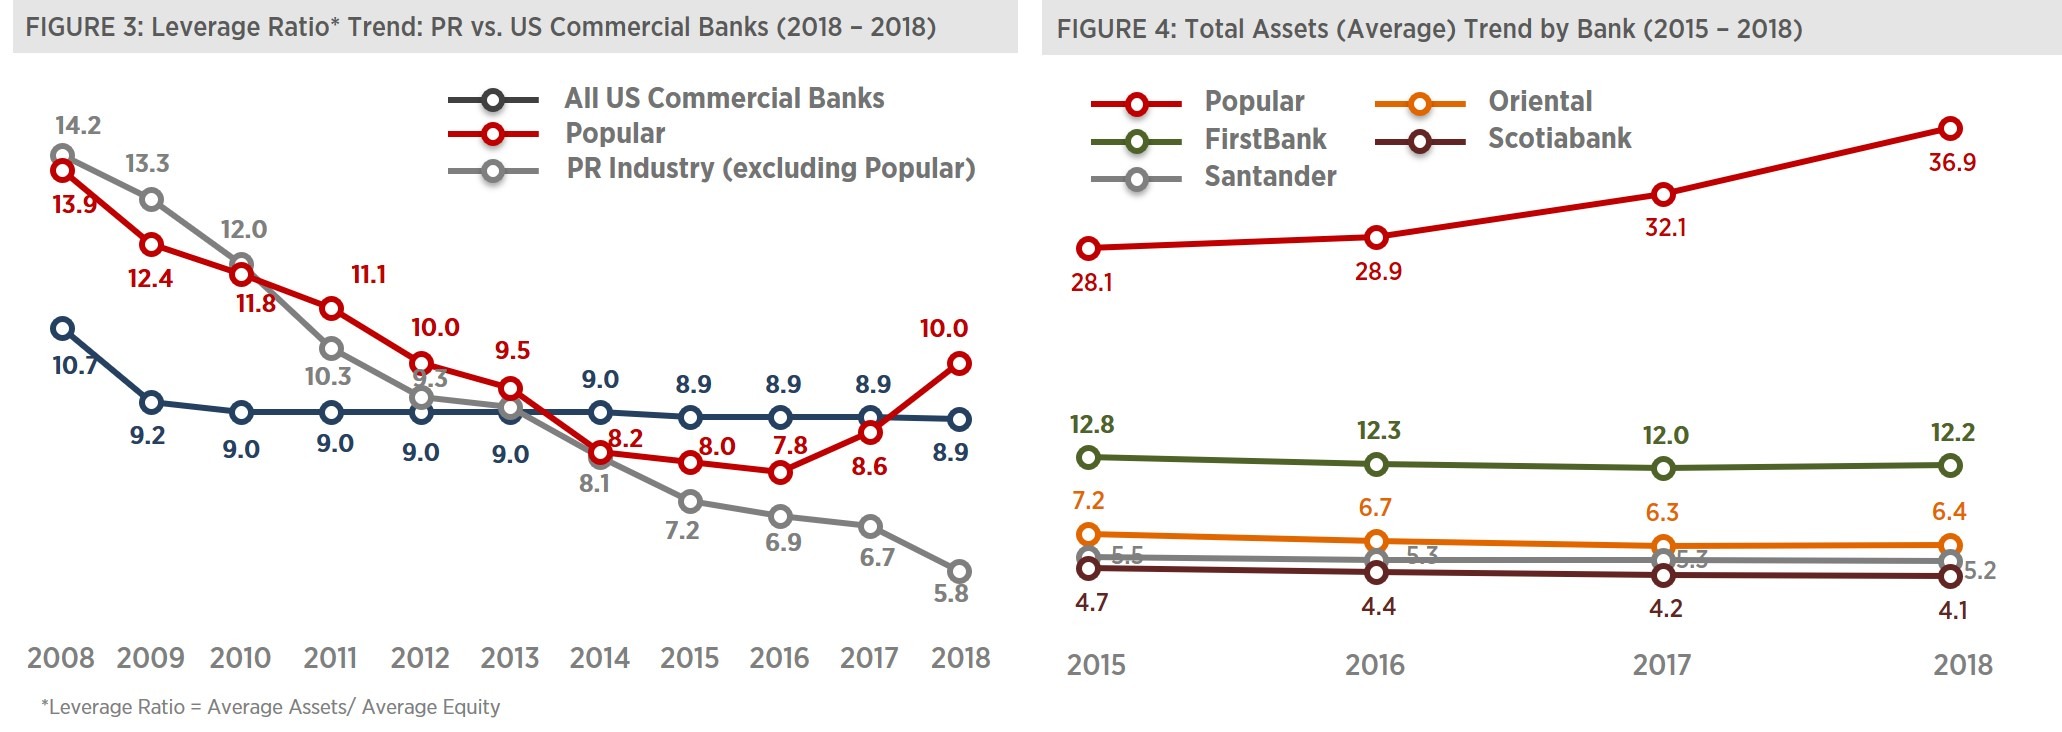
Finally, the last component of profitability is leverage, or the relation of capital to assets. In a scenario of positive net income, the higher the leverage, the higher the Return on Equity. Recapitalization, deleveraging, and de-risking efforts put into effect by local banks have significantly impacted their leverage ratio. In 2008, the PR industry leverage ratio was approximately 14, decreasing to 5.8 in 2018 when excluding Banco Popular (see Figure 3). Popular has been diverging from its peers, and closed 2018 with a leverage ratio of 10.0, surpassing US commercial banks. The recent trend of Banco Popular’ leverage ratio is mainly explained by the increase in total assets the bank has experienced during the past four years, from $28.1 billion in 2015 to $36.9 billion in 2018. This increase came from inorganic growth initiatives like the acquisition of part of Doral’ assets and the acquisition of Reliable Auto.
In conclusion, the PR banking industry closed 2018 with an excellent performance in terms of profitability, despite the negative impact of Hurricane María. We do not expect 2019 to be different, unless unexpected events take place in the local market. If anything, we would expect some of the key levers of profitability to improve. For example, the recent increase in consumer loan originations vis-a-vis mortgage and commercial originations should translate into an increase in the net interest margin, and the steady decrease in non-performing loan inflows should translate into lower provision expense. But the question still remains on the growth side, as opportunities to grow inorganically are more scarce. On the organic growth side, the much expected recovery funds from the US government should help local banks increase originations. But do not expect local banks to loosen their tighter underwriting policies to grow their loan portfolios and fuel economic growth.
Notes
*Total noncurrent loans and leases, Loans and leases 90 days or more past due plus loans in nonaccrual status, as a percent of gross loans and leases
Sources
V2A Banking Indicators Portal (http://prbankindicators.v2aconsulting.com/); Federal Deposit Insurance Corporation (FDIC) Comparison Reports (https://www5.fdic.gov/sdi/main.asp?formname=compare)
Disclaimer
Accuracy and Currency of Information: Information throughout this “Insight” is obtained from sources which we believe are reliable, but we do not warrant or guarantee the timeliness or accuracy of this information. While the information is considered to be true and correct at the date of publication, changes in circumstances after the time of publication may impact the accuracy of the information. The information may change without notice and V2A is not in any way liable for the accuracy of any information printed and stored, or in any way interpreted and used by a user.

