
Summary
Continuous technological changes in the Telecommunications industry are forcing Telco’s to constantly embark on Network Transformation programs and ask themselves how to better invest their capital expenditures to obtain the biggest bang for their buck. Our CAPEX Optimization methodology offers a comprehensive six-step method to ensure Capital intensive enterprises can do just that.
- Define the strategy that will guide the capital investment: How will our network look in 5 years and how much capital are we willing to invest to do it?
- Breakdown network into smaller projects that can provide solid data per home/subscriber to make smart decisions
- Calculate real costs by understanding the real drivers
- Rank projects based on key metrics that represent the overall strategy
- Maximize tactical synergies
- Establish the governance and continuous improvement culture
Introduction
In the next five years, Telcos across the US will have received more than $65 billion in subsidies to extend and improve broadband coverage to areas that are underserved. The COVID pandemic has accelerated the need for high-speed broadband and unearthed a big gap between communities based on their access to this service. A proposed infrastructure bill in Congress will most likely address some of these gaps, and so will other funding sources from the FCC, the USDA and other agencies. Most, if not all, agencies are addressing access to broadband, as well as enablement of digital transformation as part of their agenda for the next 3 years.
On the Telco’s side of things, bids for funds to deploy broadband, or extend mobile coverage (or gain additional spectrum) are becoming part of the “business as usual”. Once awarded, the effort required to plan a full-scale deployment can be overwhelming. Regardless of the opportunities arising from federal funding, most fixed providers if not all, have an agenda to revitalize their networks and deploy fiber to the premise (FTTP) networks in the next 6-10 years. This requires a heavy amount of spending and planning.
This challenge is not for Telco’s alone, as any capex intensive enterprise, like utilities companies, public works departments, transportation or real estate development industries will run into the same questions: How can I optimize my capex investment? How can we be more strategic and more efficient in our spending? How can we become more agile in execution?
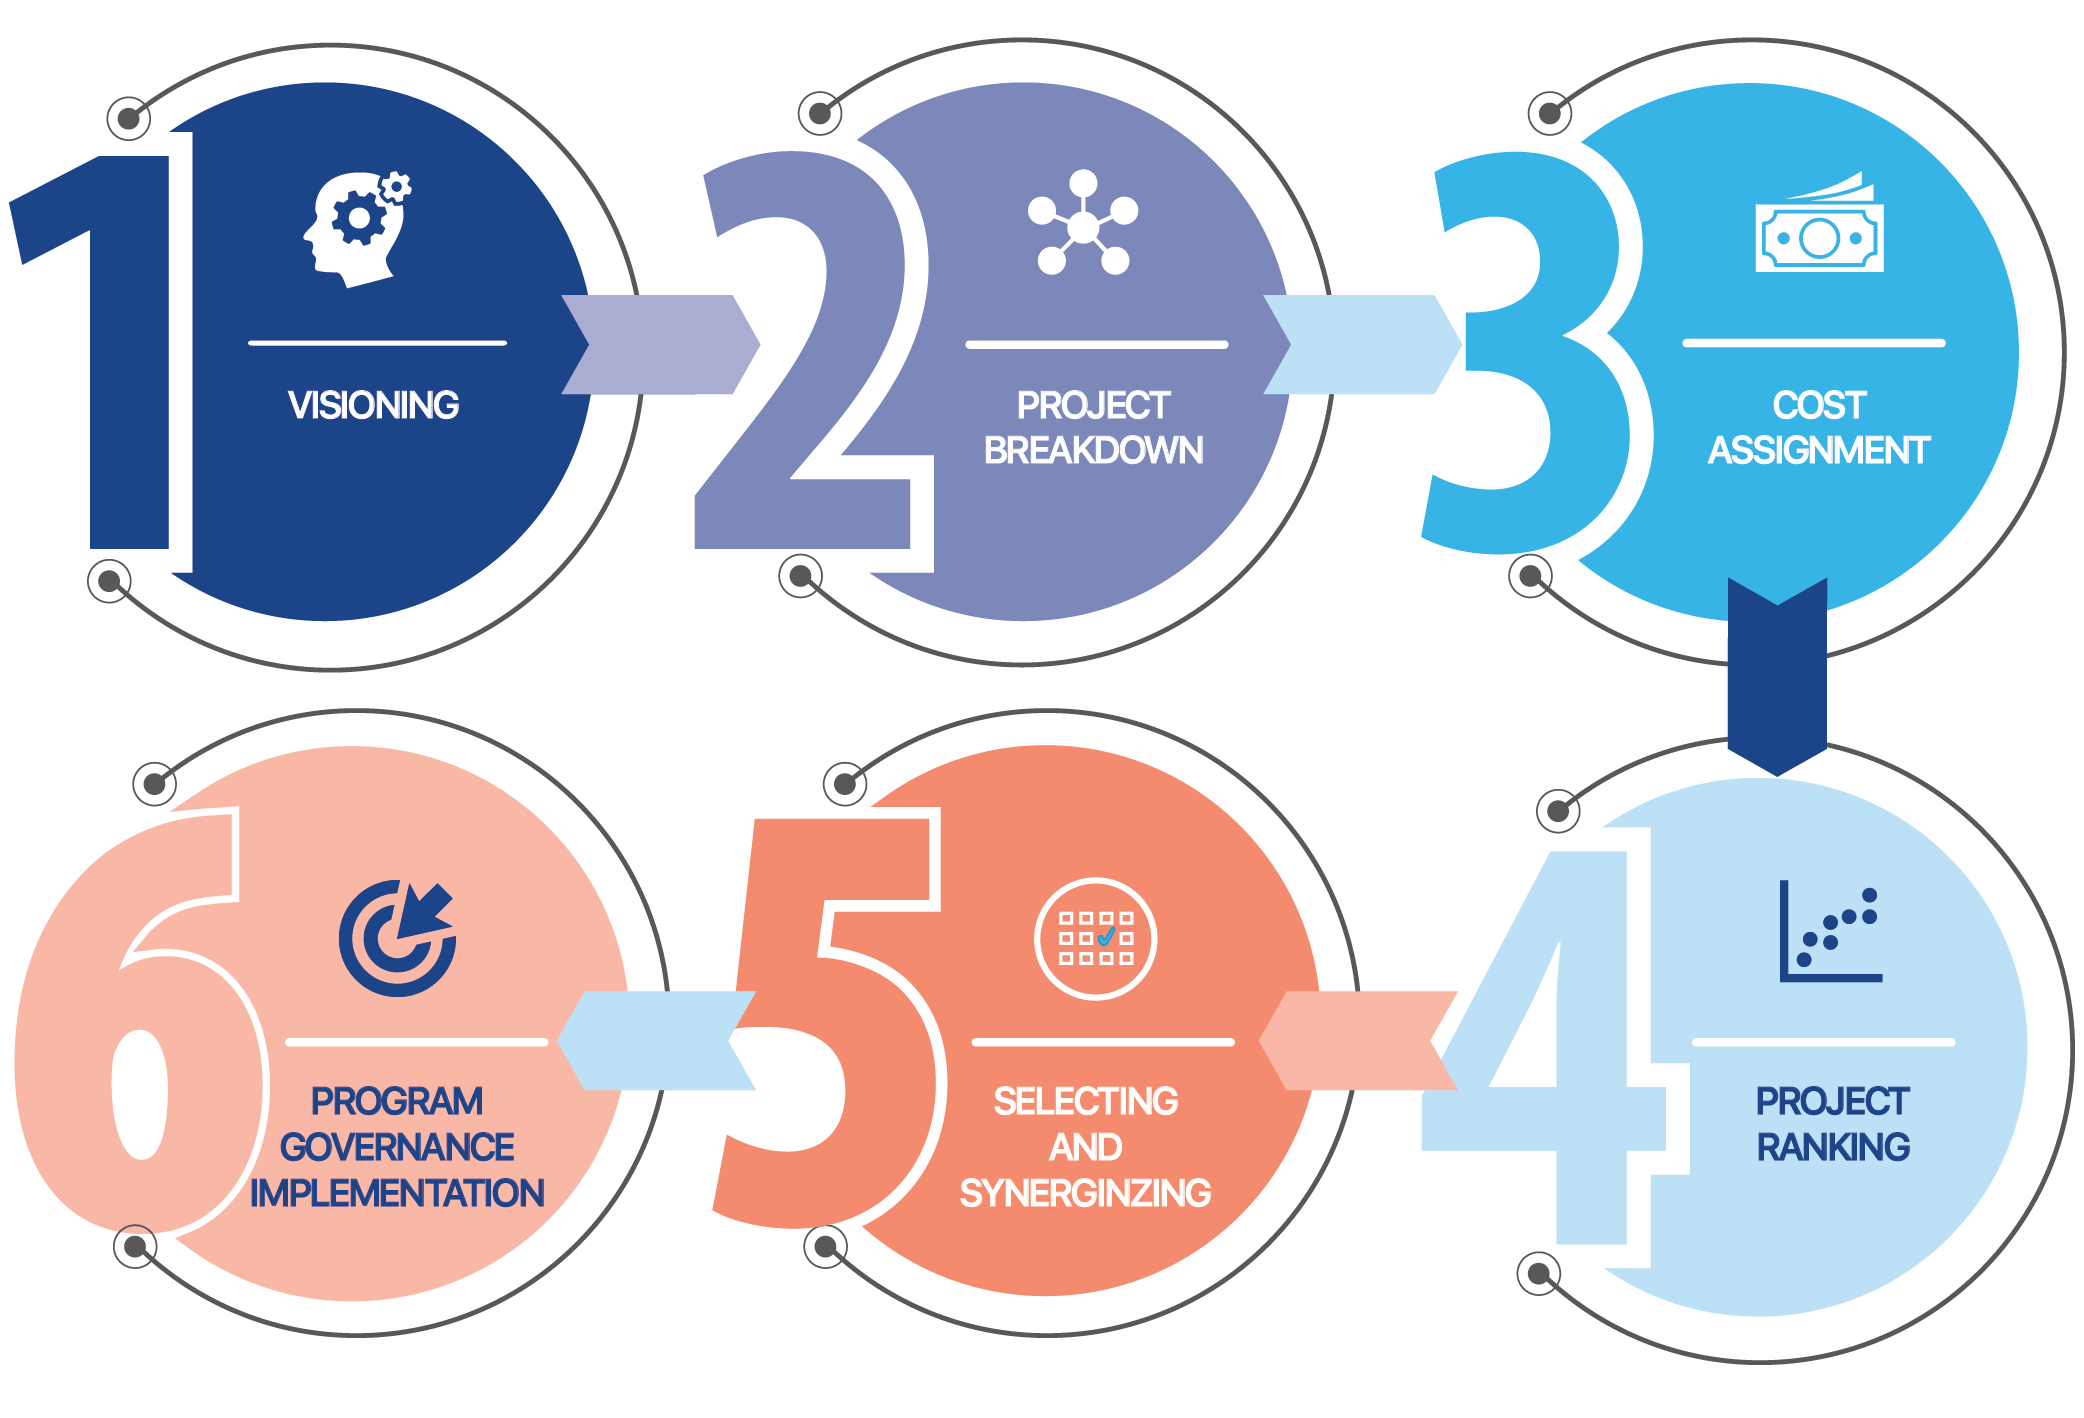
Over the last few years, V2A Consulting has supported several of its major clients in answering these strategic questions, which have helped the firm develop a deep understanding of how to approach this issue. Subsequently, we have developed a comprehensive methodology to efficiently plan and execute a Capex plan, and it consists of 6 major steps: 1) Visioning 2) Project Breakdown, 3) Cost Assignment, 4) Project Ranking, 5) Selecting and Synergizing, and 6) Program governance implementation, refer to Figure 1.
Figure 1: V2A’s Capex methodology
 A Methodology for Capex Optimization
Step 1: Establishing the vision. What are we trying to accomplish?
Telcos can have a plethora of reasons for wanting to deploy large-scale capex programs. A few that come to mind are: an urgent need to upgrade or substitute an outdated technology (copper, HFC, 3G), a commitment of federal funds to reach underserved areas (RDOF, CAF, Re-Connect), or a commercially driven expansion program to areas not yet reached. Whichever the rationale, the first step is to define that end-state, measurable objective of the program: is it a new and improved network with more resiliency (% underground)? Is it more than 80% of the network upgraded to Fiber to the Premise (FTTP)? Once this is defined, you can begin to plan your deployment and track its progress.
Step 2: How do you eat an elephant? (Breaking down a big plan into “digestible” projects)
 When thinking about Capital Investment, Telco’s will look at their network and question where should they start? How much of the network can be upgraded to FTTP? To answer such questions, Telco’s should look to breakdown their network into smaller, more measurable segments. However, the breakdown methodology should consider the ability to group these smaller segments to facilitate decision making, in other words, make them more digestible. In doing so, we address greenfield and overbuild separately.
To breakdown unserved areas or “greenfield” projects, while data is harder to find, we can leverage data published by government agencies like the Census Bureau or the FCC. These agencies publish valuable information to breakdown the greenfield areas into smaller segments (subdistricts, census blocks, census tracks, etc.) for which we can find useful data like mean and median income, population, and estimated home counts.
When considering overbuild projects on an HFC Network, the company could break down its deployment into HFC optical nodes, which is equal to approximately 600 serviceable homes (or homes passed). HFC optical nodes provide small enough segments that could be treated as individual projects, but big enough to encompass a measurable amount of work. Additionally, these Nodes can provide data respective to a specific home count with a defined subscriber base, which means we can measure its network performance, the cost to build, as well as its commercial value, or revenue generated from its subscribers.
Step 3: Will the real cost of a buildout please stand up?
The common industry-wide approach is to calculate costs based on average cost per home passed. This calculation basically sums up the total cost of a previous project and divides it by the total homes in that project, and then uses that result to forecast future projects. If a buildout project costs one million dollars ($1M) and ten thousand (10,000) homes are now serviceable, then the cost per home passed is $100/hp. However, construction companies usually do not charge a “per-home” cost, and fiber strands are not priced per home, so the “real” cost is based on footage/mileage, and labor costs could also incorporate productivity (i.e. feet per day). The common pitfall of the “per home passed” estimation is a miscalculation of density; whereas decreasing density will tend to drive up costs faster than forecasted.
Therefore, a proposed first step in calculating buildout cost is to understand all the cost drivers in delivering serviceable homes. When talking about a Fiber to the Premise (FTTP) network, the key cost drivers to analyze are construction labor, fiber and material costs, core equipment (inside plant), field surveying labor, design fees, permits and taxes. When looking at costs, most are driven by the total distance of fiber routes, and to a lesser degree by number of homes to be delivered, expected number of customers connected. Cost can also be impacted by the distance from central offices, since fiber strand counts within segments can vary with distance.
For example, labor and material costs are driven by both distance and number of homes; field surveys and design are priced in terms of mileage, while the Core Equipment costs depends on the number of homes to be served. Therefore, both homes and mileage can drive costs, however mileage has the most impact on the total cost, driving 72%-85% of the total cost depending on the type of construction (e.g. mileage impact for aerial is 75%, 85% for underground, and 72% for Push/Pull).
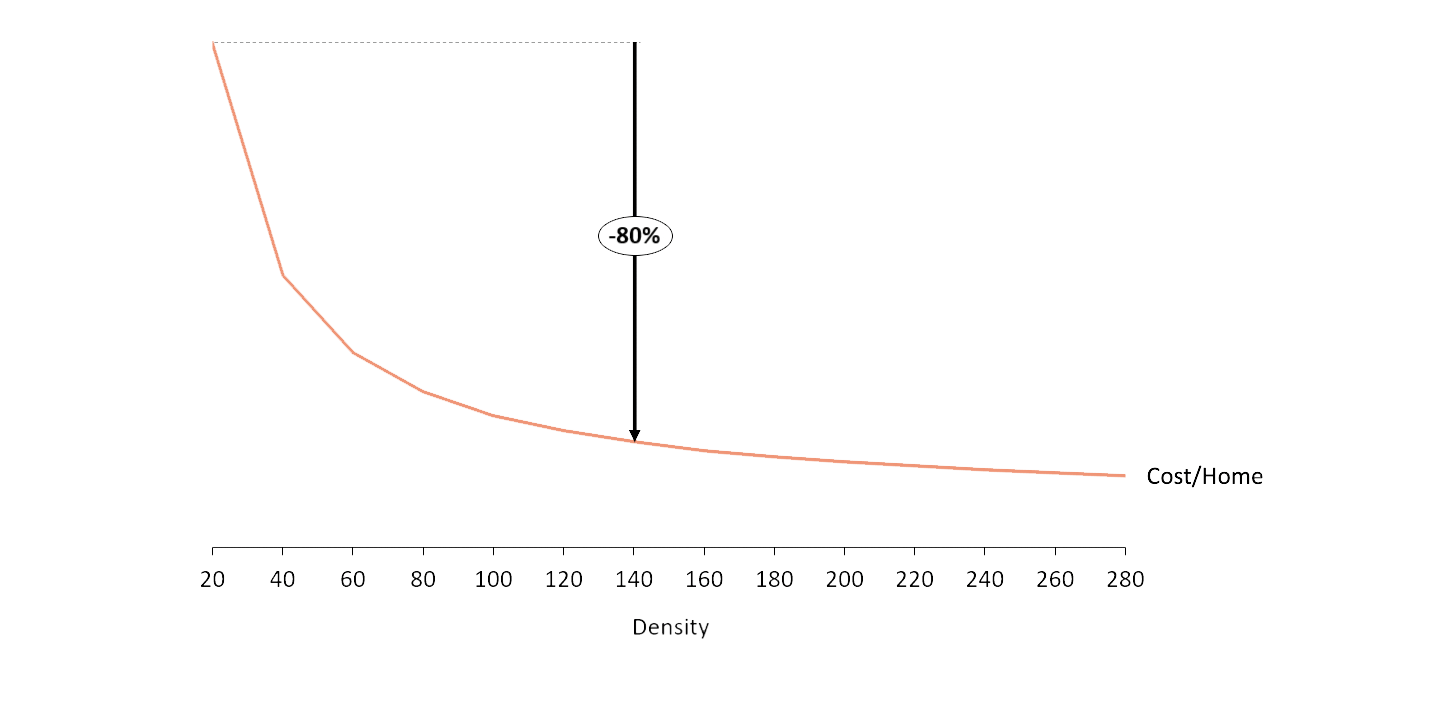
Considering that mileage is the most important driver on cost, herein lies the reason a top-down approach based on Cost/Home might not be accurate when considering variations in density. Cost/Mile is resistant to variations in density, aside from splitters and distribution hardware like Fiber Distribution Hubs (FDH) and Fiber Access Terminals (FAT). However, Cost/Home is drastically impacted by Density when considering lower density like those found in rural areas. When evaluating the costs when increasing the density from 20 Homes/Mile to 140 Homes/Mile, the Cost/Home decreased by 80% while the Cost/Mile remained fairly constant.
Figure 2: Cost/Home vs Density (Homes/Mile) ad
 As previously mentioned, Telco’s use a Cost/HP approach when forecasting deployment capex which does not consider changes in density. Ideally, providers would be able to anticipate the total number of miles to build per project. Now, what other options does a company have if mileage per project is not available? The standard approach when actual distance is not available is to estimate number of serviceable homes (or homes passed) to be delivered in a project, and then assume a density (Homes/Mile) to estimate the total milage to be built. A more accurate approach for this could be to group projects by town or county and take samples of density in each, using GIS tools, and apply this density to the entire project. In bigger deployments, a project profile can be created based on density, where some projects can be categorized by urban (high density), sub-urban (medium density), rural (low density), and remote (very low density).
Once cost factors and drivers are understood, the next step would be to calculate deployment costs for each of the projects defined previously. If HFC nodes are used to breakdown the network into projects, the number of homes per project would be known. In the case of greenfield projects, these are broken down based on other criteria like census blocks, or coverage areas (for wireless providers), or even postal codes, for which total homes can also be accurately estimated based on available data or preliminary surveys.
With miles and homes available per project, the exercise of calculating overall deployment cost is a matter of P times Q, P being Cost/Mile and Cost/Hp and Q being the number of miles and homes. With this bottom-up approach, Telco’s can calculate what is the real cost to deploy a FTTP network.
Step 4: What can we do within our budget and capacity constraints? Where is the value? How to rank projects?
Telco’s that can already estimate the actual cost to build and deploy, still need to understand where to start. The total capex needed to deploy at scale is usually in the tens or hundreds of millions of dollars per year. Therefore, to optimize these capital investments, and capture the most value at the right time, Telco’s may need to prioritize and set smart deployment goals. These goals will vary depending on the type of construction pursued. When targeting unserved areas or “greenfield” projects, Telco’s should be looking for incremental revenue, solid ROI, while in overbuild “brownfield” scenarios, they should be trying to protect their existing customer base, while providing a better experience and faster speeds.
When ranking greenfield projects, the most important ROI drivers are: forecasted incremental revenue, and future penetration over time. To calculate potential incremental revenue, a projected ARPU (Average Revenue per User) and penetration should be assumed based on a) similar communities already served based on median household income, which can be studied using census data, or b) similar communities based on home prices, if available.
In overbuilds, the strategy could be quite different. If a company is not well penetrated or is not an incumbent in a region (low market share), then it could follow a similar strategy to a greenfield project, vying for new revenue and solid ROI, within the competitor’s footprint. However, for a market leader, the approach should be different because most probably it would be playing a defensive game. This means, in order to protect the current customer base from being poached by other providers with better networks, the company upgrades its current plant, and therefore its service offering, limiting churn and increasing the barrier of entry for incoming competitors.
When ranking overbuild (“brownfield”) projects, Telco’s should be able to extract important information from its CRM or billing systems. The prioritization of projects can be based on multiple drivers like Monthly Recurring Revenue (MRR) per project (node, segment, area), as well as Penetration Rate, and average revenue per user (ARPU). However, we have found that when establishing a defensive strategy, an indicator that best encapsulates the value of a project is “monthly recurring revenue per home passed” or “MRR/HP”. This indicator helps prioritize projects with high penetration and high ARPU even if the project is not extensive in terms of total homes.
With these metrics available, Telco’s can also decide which they want to weigh more heavily to rank their projects. For example, if the Company wants to prioritize revenue over cost, they might weigh MRR/Home more heavily than Density or vice versa as seen in the figure above. As seen in Table 1 below, even though the highest-ranked projects based on MRR/HP have the lowest densities, they are still ranked the highest because Revenue was prioritized over cost.
Table 1: Example of Project Ranking Matrix (MRR/HP weighted over Density)
 With the ability to measure specific projects by these metrics and weigh them in accordance with the company’s strategy, Telco’s have the capability of knowing both the cost and the commercial value of each project.
Step 5: How to organize projects and synergize efforts?
After ranking and selection has been done, based on ROI, defensive efforts and real costs, it is time to decide where to start and how to group multiple projects in a single stream to capture the value of synergizing.
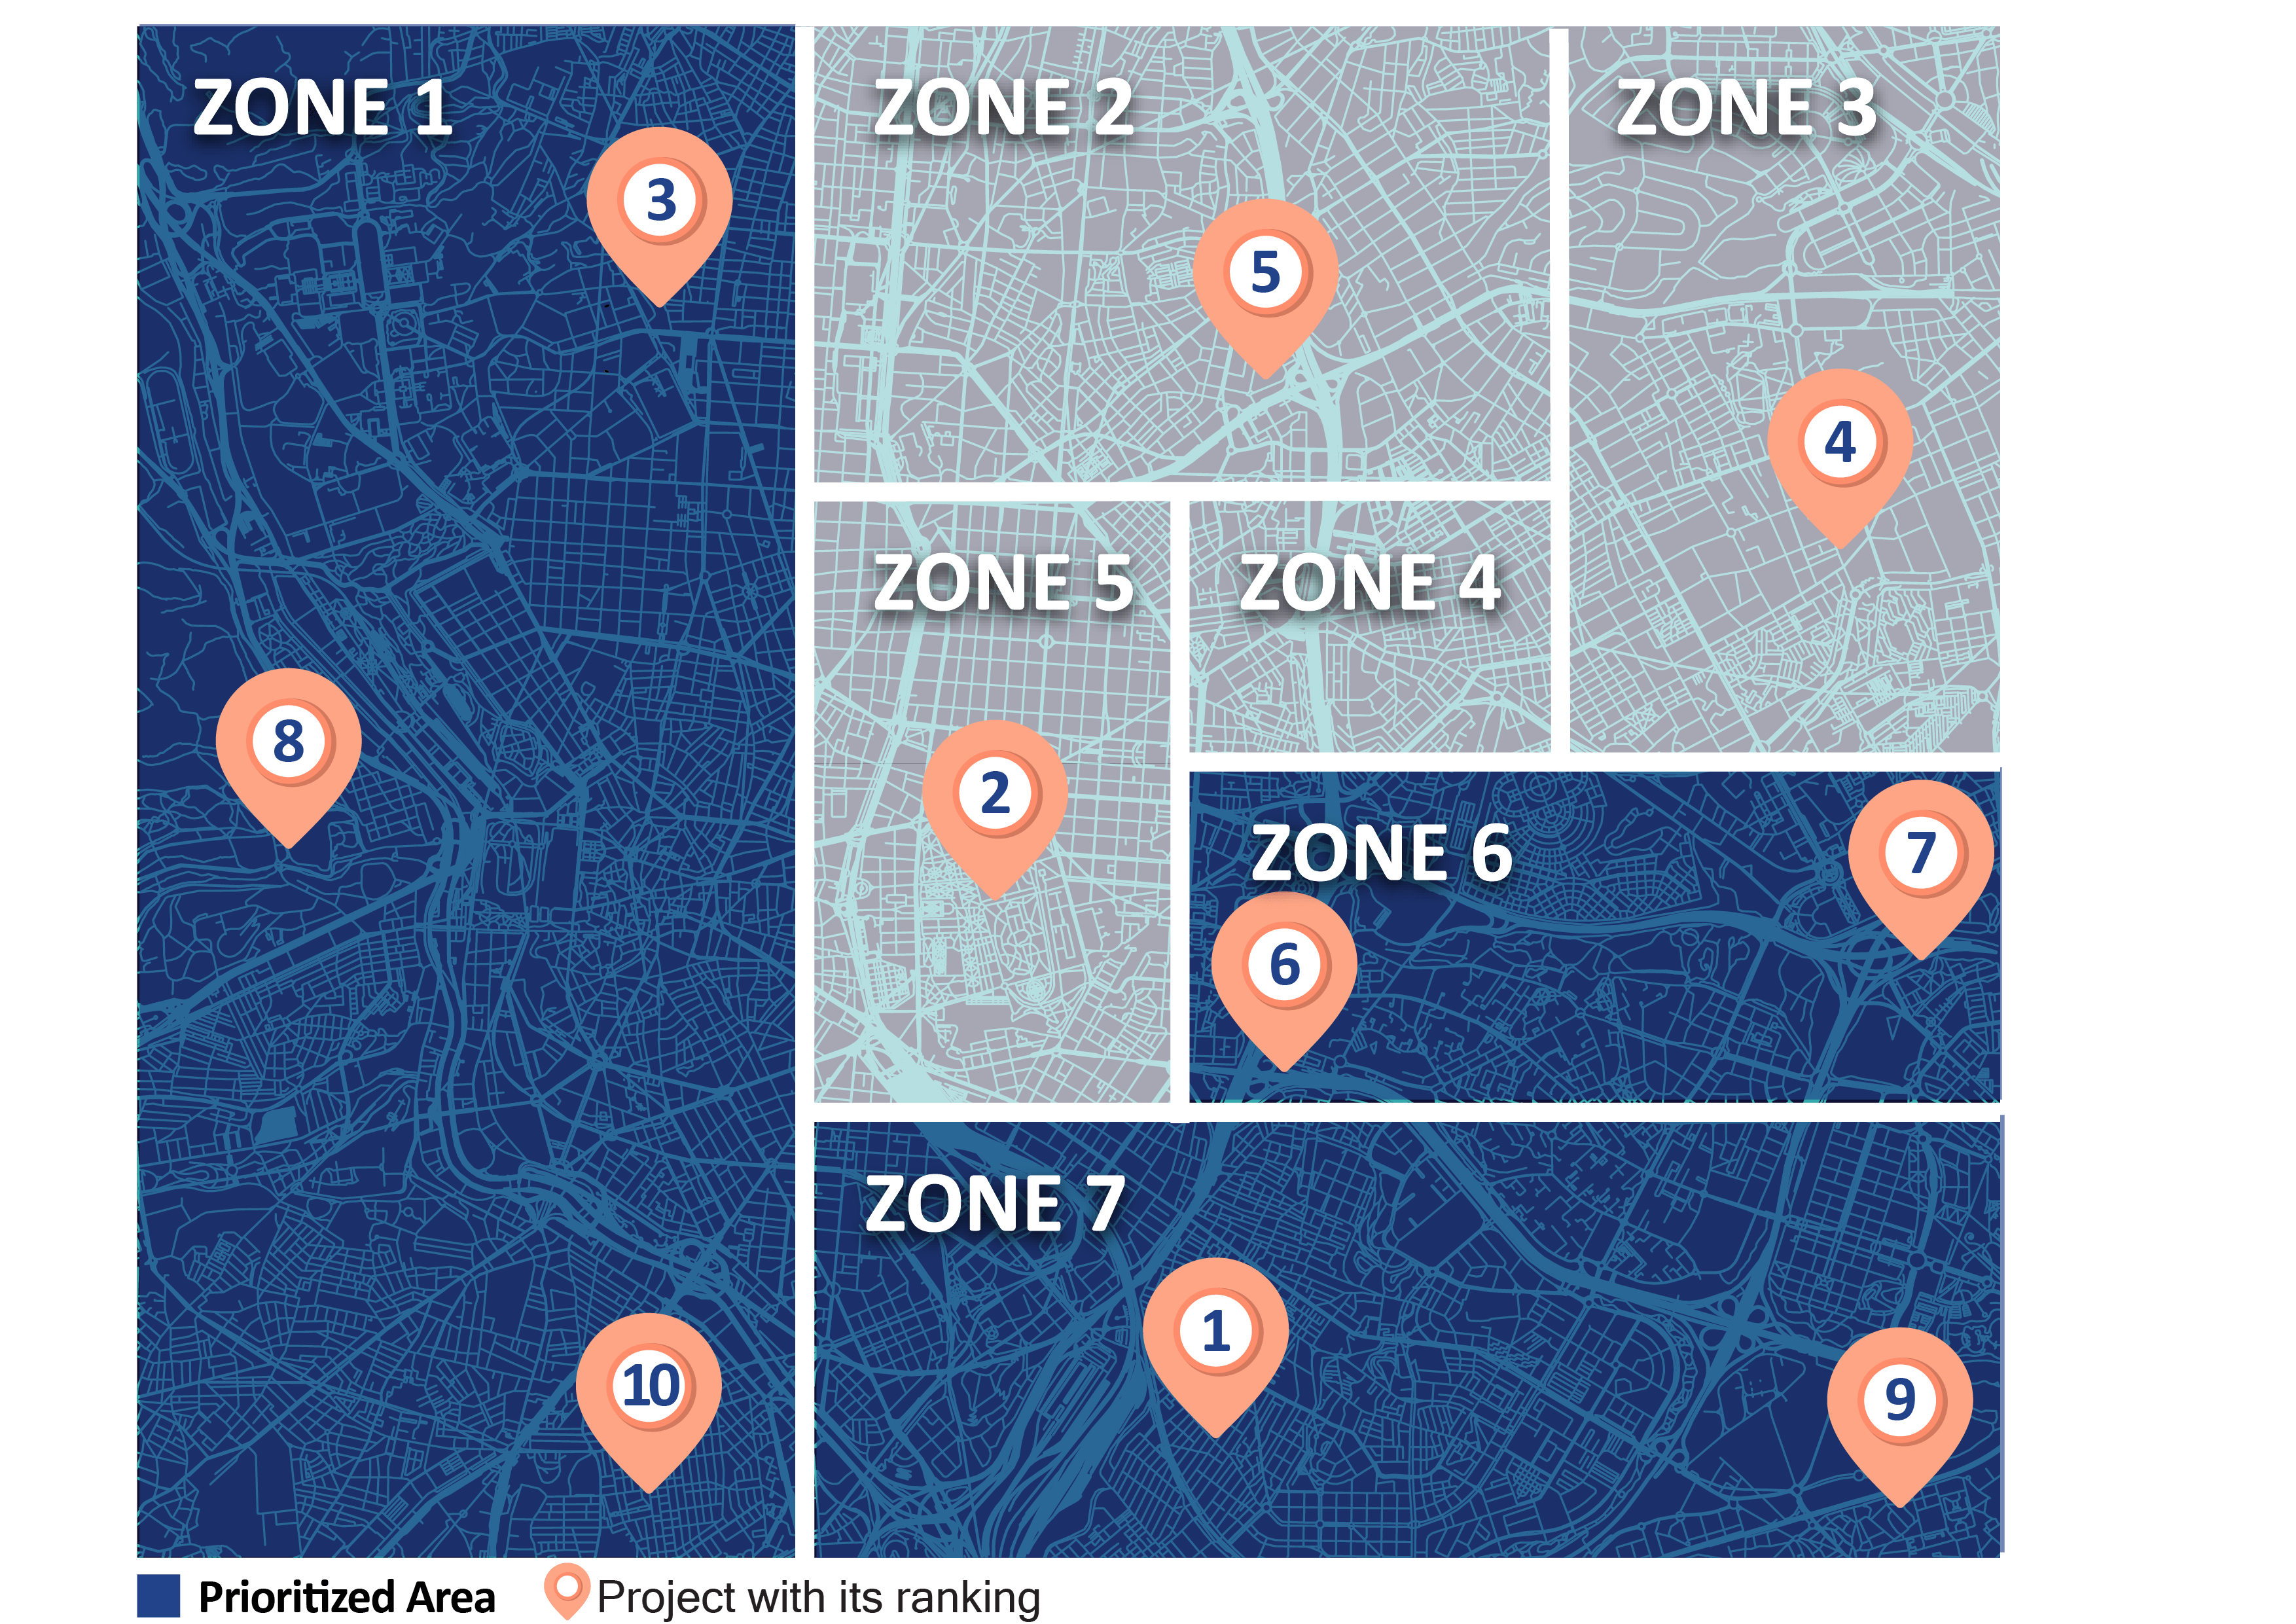
Project rankings give Telco’s a good idea of which pieces of the pie are more valuable and should be eaten first, however there are nuances to each project and geographical area that are not evident in the selection, and ranking process. For example, one might find that the ranking results might have identified valuable projects all over the network without taking in consideration other execution realities. When considering labor and supply chain realities, there is some value to be had by considering regional synergies. There is also value to consider project proximity when considering customer equipment migrations and how fast these migrations can be executed. A commercial team could develop geo-fenced marketing campaigns if multiple contiguous projects are built consecutively. Figure 3 shows how one would go about prioritizing projects that might be further down in the ranking but are in close proximity to other with higher rank to leverage regional synergies.
Besides regional synergies, competitive forces need to be considered when deciding where to start. Should we build where are competitors have already built and are making efforts to gain market share? Or should we build where are competitors are not strong and we can solidify our base and increase barrier of entry?
At this point is where common sense helps us really set the order of priorities in the deployment and produce a detailed project plan. We would ask: are there multiple projects that are close in proximity, where we can deploy a single construction crew and save time and effort in transportation, as well as in geo-fenced marketing?
Figure 3: Regional Synergies should be considered when prioritizing project execution since Ranking does account for potential tactical efficiencies
The end result is a multi-year, multi-million-dollar project plan that incorporates all factors in hand and provides visibility to all stakeholders in order to optimize capital investments for this Telco.
Step 6: Continuous Inspection and Recalibration
In order to keep this program strategically aligned with the company’s long-term goals and also adaptable to market dynamics and consumer behaviors, a process of continuous improvement, and overall evaluation must be put in place. A defined governance can help keep track of the success of the program, give visibility to all stakeholders in terms of KPIs, as well as recommend changes in the plan to accommodate for commercial opportunities or competitive risks. For example, if the plan is to overbuild a copper infrastructure with FTTP in 5 years, but by the third year 5G or Fixed Wireless Access has become mainstream, then the company can adjust its current plan and shift focus and resources to incorporate a wireless deployment. A well-executed governance essentially consists of a defined cadence of meetings based on objectives, which can include weekly operational reviews, monthly steering committees and quarterly or bi-yearly strategic planning sessions.
Conclusion
The complexities of spending capex at scale and making multi-year plans can be easily overlooked or underestimated. Telcos that follow a well-structured approach to spending, based on strategic objectives, like increasing ROI or protecting their customer base are more likely to succeed. Their ability to remain agile by breaking down larger deployments into smaller, more digestible projects, will help them make better decisions and achieve those goals. As government funds are made available, and other commercial opportunities to deploy broadband at scale continue to arise, Telco’s, small and large, will need to figure out how to optimize their investment in the short term, while being able to adapt to long term changes.
Epilogue: How to eat a different type of elephant? (How other industries can benefit from this methodology)
The beauty of a Capital Investment Optimization Methodology is that it is relevant to any capex-intensive industry. In Puerto Rico, for example, after Hurricane María, FEMA authorized $9.6 billion to rebuild the island’s power infrastructure, and additional funding to rebuild its water infrastructure. Both its power authority (PREPA) or its water and sewage company (PRASA) could be interesting use cases for this methodology. Strategic planning or deployment teams should approach their capex spend by:
- Define the strategy that will guide the capital investment
- Breakdown its infrastructure into measurable projects that can provide solid data per home/customer
- Calculate actual costs to build per project based on mileage and other cost drivers
- Rank its projects based on key metrics that impact service within those projects, for example:
- Number of power outages / or water spills per home
- Number of truck rolls, trouble-calls or customer service interactions per home
- Energy or water consumption per home
- Synergize based on proximity, level of effort and other variables
- Establish the governance and continuous improvement to keep the program strategically relevant
Disclaimer
Accuracy and Currency of Information: Information throughout this “Insight” is obtained from sources which we believe are reliable, but we do not warrant or guarantee the timeliness or accuracy of this information. While the information is considered to be true and correct at the date of publication, changes in circumstances after the time of publication may impact the accuracy of the information. The information may change without notice and V2A is not in any way liable for the accuracy of any information printed and stored, or in any way interpreted and used by a user.
ONLY ENGLISH VERSION

